
Claude Code × Medical Application
[Claude Code] Turning an In-House BI Dashboard into an AI Dashboard, Part 0: Overview and Design
1. Introduction — we turned an in-house BI dashboard into an AI dashboard
Companies have plenty of BI dashboards built in Tableau or Power BI: sales trends, area maps, rankings of accounts or customers. BI has its pains, though.
- Every viewer needs a license
- You have to learn the tool before you can reach the screen you need
- When the person who built it leaves, nobody is left who can fix it
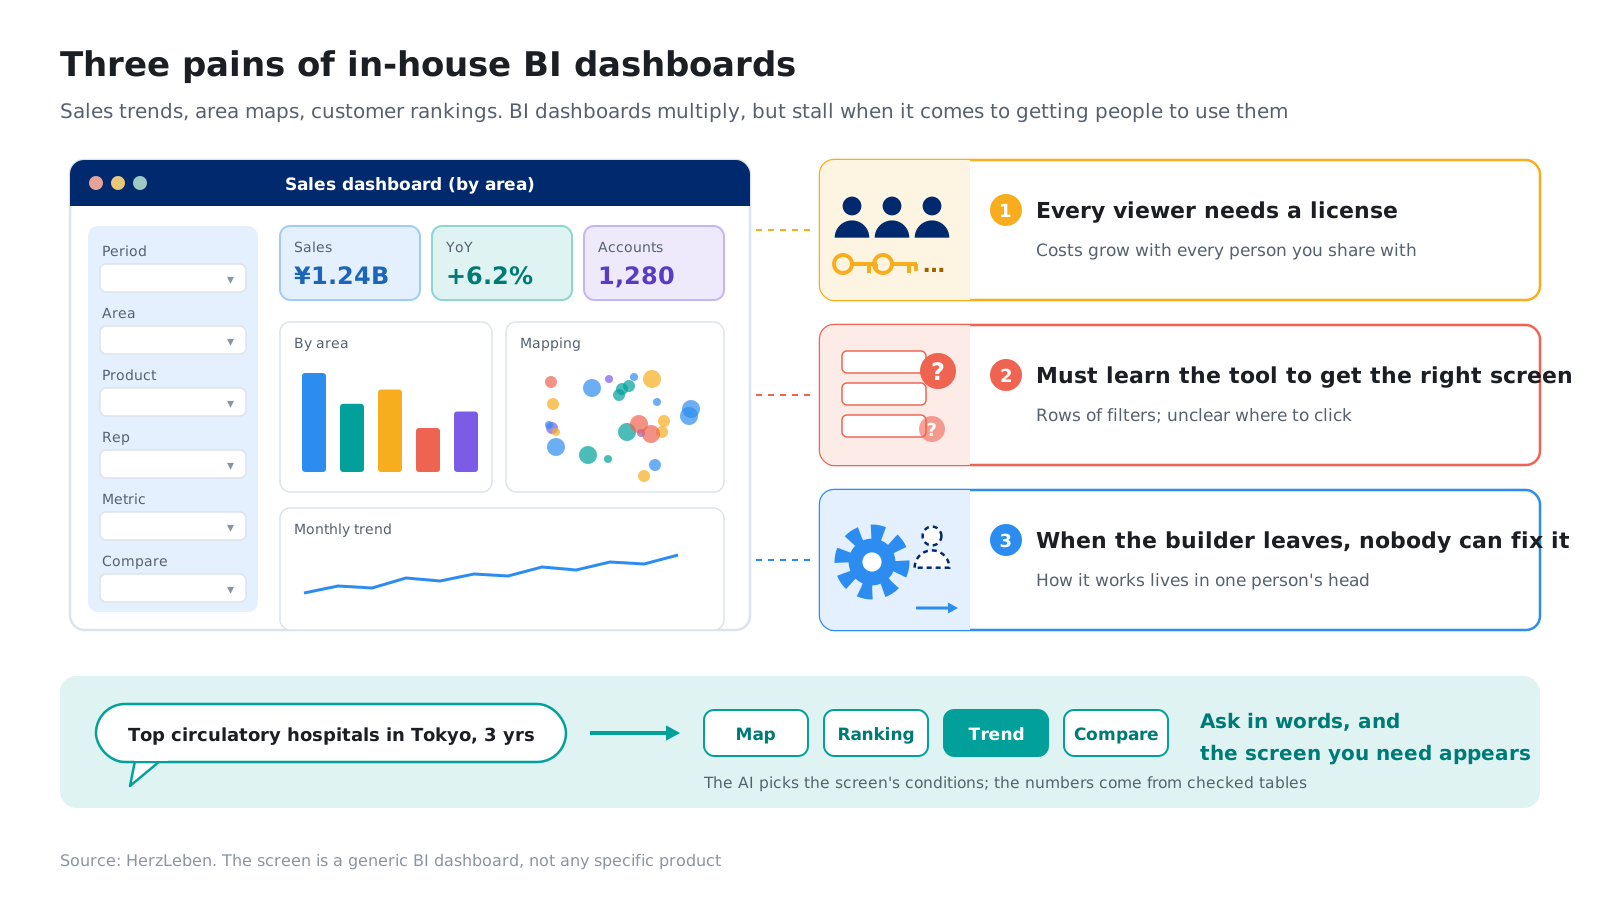
So we turned that kind of BI into an AI dashboard you can talk to. Type “Hospitals in Tokyo with the most circulatory cases, over three years” into the box, and the AI picks the screen’s conditions; the map, ranking, trend and comparison screens switch accordingly. You call up the screen you need with words instead of clicks.
Company data cannot be shown in a blog post, so we used Japan’s DPC open data, published by the Ministry of Health, Labour and Welfare and free for anyone to use: FY2022 to FY2024, 6,448 hospitals. Read “hospital” as “customer account,” “region” as “sales territory,” and “disease” as “product,” and it has the same shape as an in-house sales or territory dashboard. What the data contains and how to read it is on the reference page “Japan’s DPC Open Data.”
- 6,448hospitalstook part in at least one of FY2022–FY2024
- 5screensmap, ranking, hospital details, three-year trend and comparison
- ≈0.1yenAI cost per question (calculated from measured token counts)
- 0case counts handed to the AI. Every number on screen comes from pre-checked tables
This post covers what changes, what the screens look like and how it works, with only an outline of how it was built. The build itself is covered step by step in Part 1 to Part 4 of the series, all available in English.
2. What changes
2-1. Four benefits
- No licenses needed. Viewers just open it in a browser
- Send a URL to share exactly the same screen. All the conditions, such as year, region and disease, live in the URL
- Only published figures are shown. Case counts come from tables checked in advance; the AI never produces a number
- The AI costs about 0.1 yen per question. A bot check, rate limits and a monthly cap keep costs from growing
The screen switches between Japanese and English, so a head office or team overseas can share the same screen.
2-2. Where it can replace BI, and where it cannot
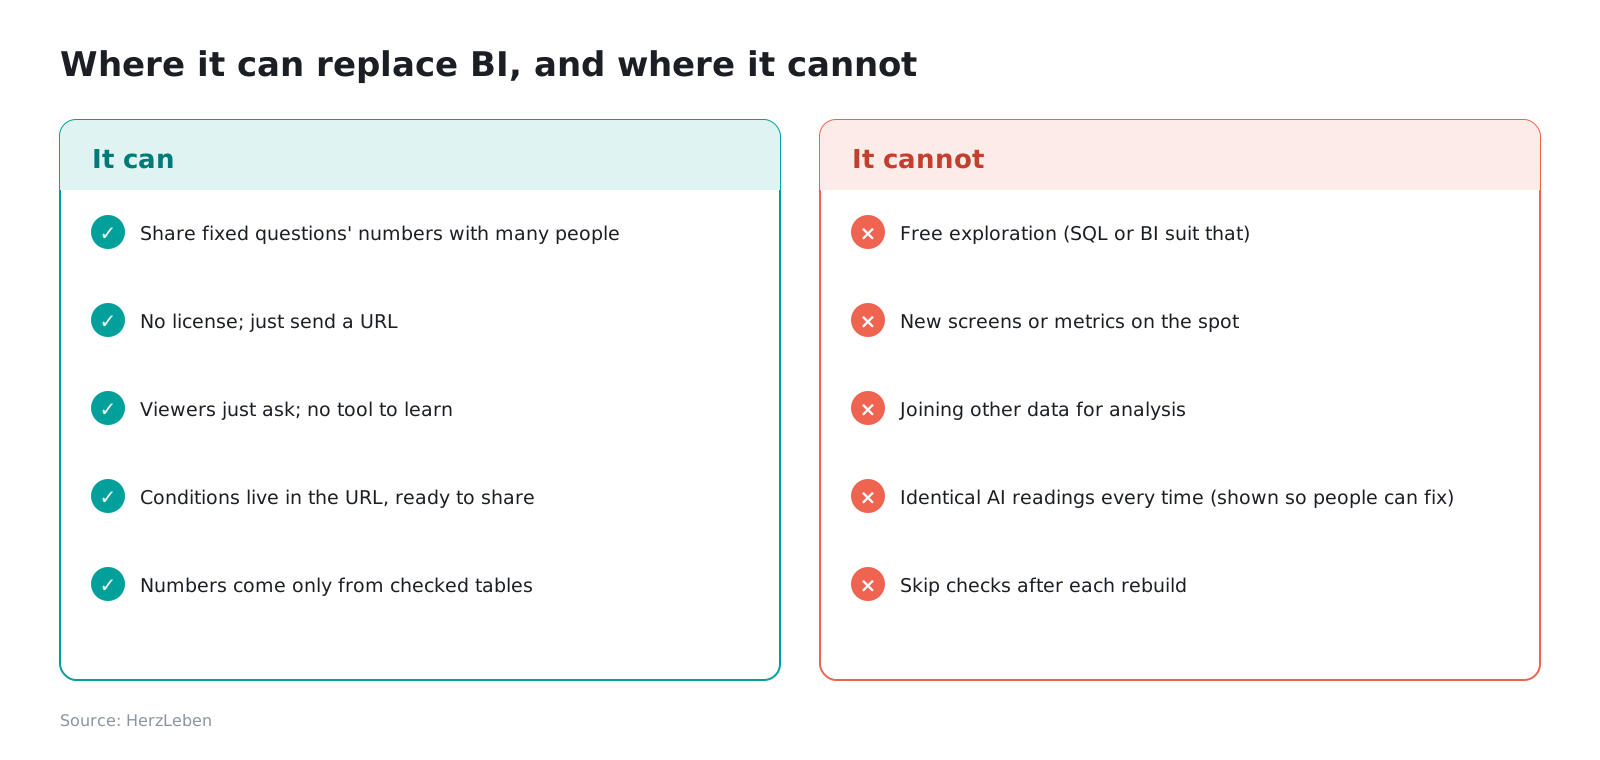
What it can replace is the part that delivers the numbers for fixed questions to many people. For analysis that digs freely along whatever angle comes to mind, or joins other data, BI and SQL remain the better tools. Rather than replacing every BI dashboard, it is realistic to start with the dashboards whose job is to deliver numbers.
3. The screens and how to use them
There are five screens: map, ranking, hospital details, three-year trend and comparison. Every screen responds both to questions typed into the box and to conditions chosen by hand. All screens except the map can be exported to CSV.
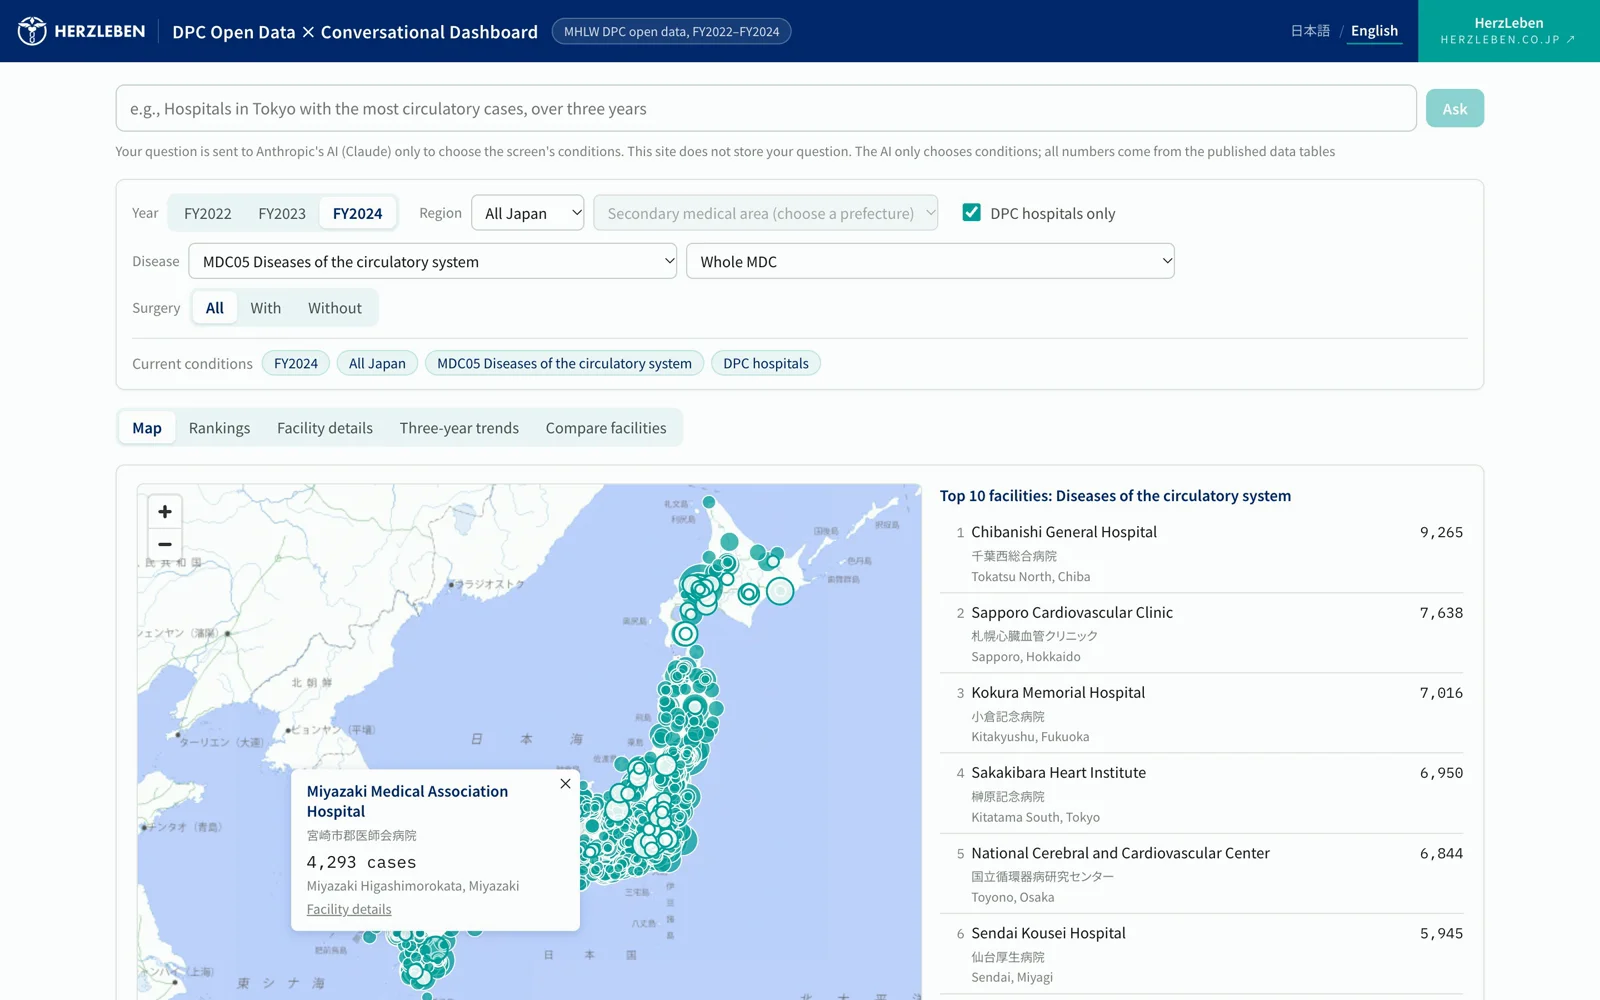
The map and the ten hospitals with the most cases. Under the English name is the hospital's short Japanese name 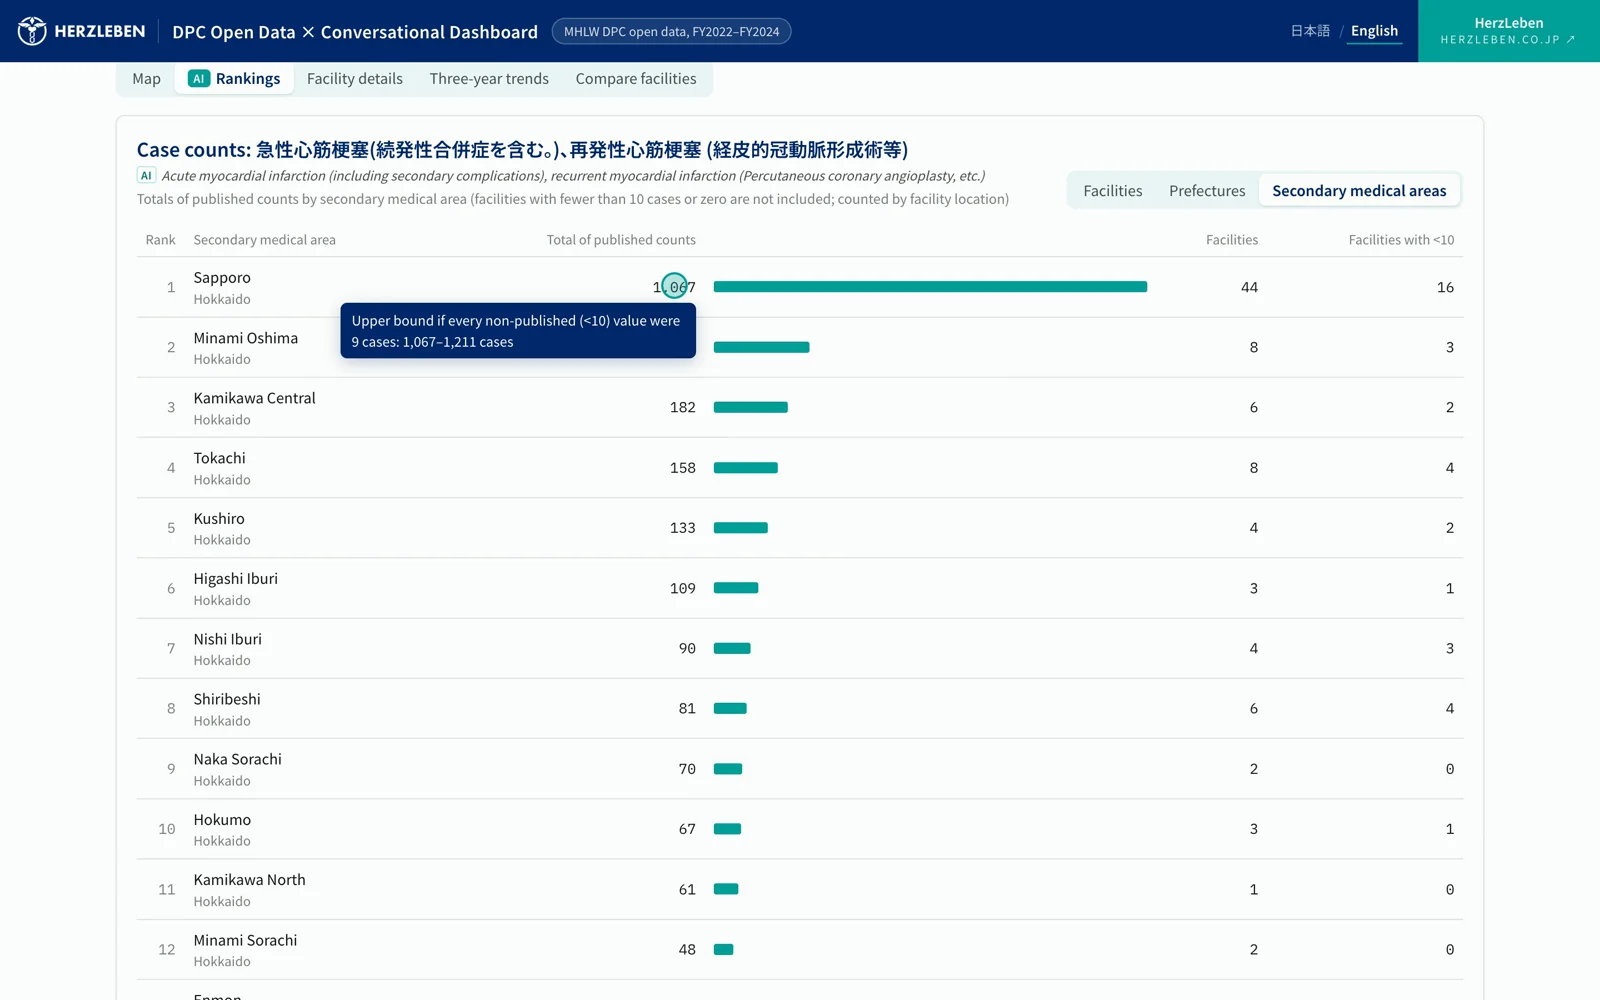
Area ranking. Regional figures are totals of published counts only; a tooltip shows the possible upper bound 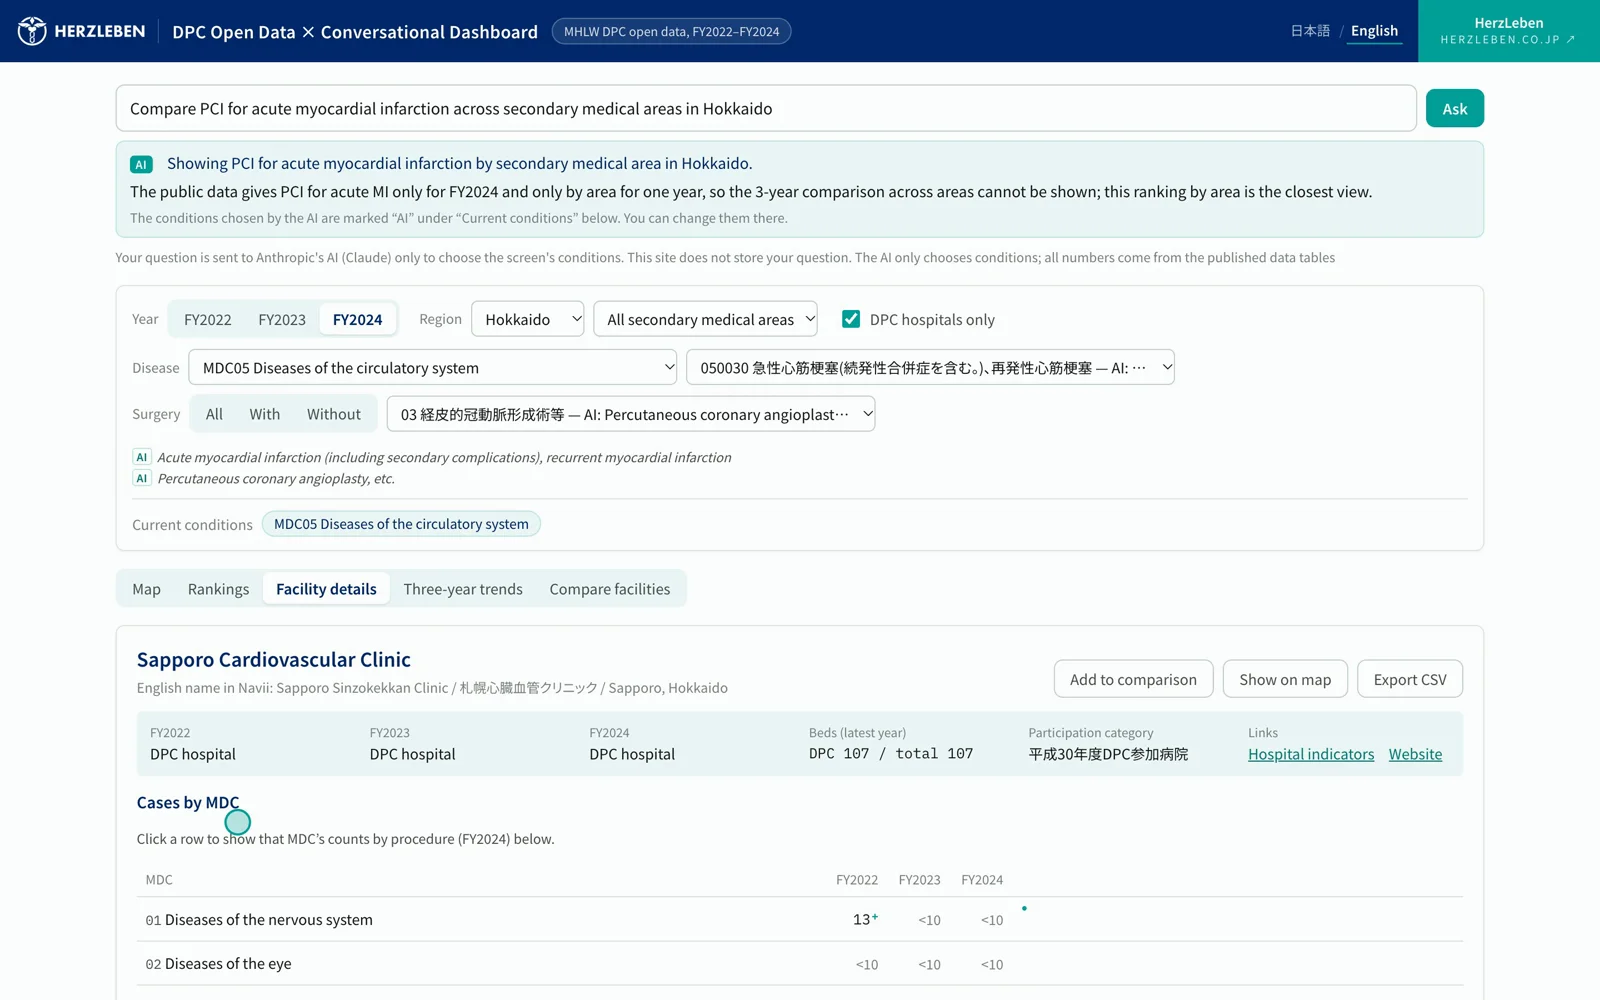
Hospital details: category for three years, beds, cases by MDC for three years with small sparklines, and FY2024 cases by surgery 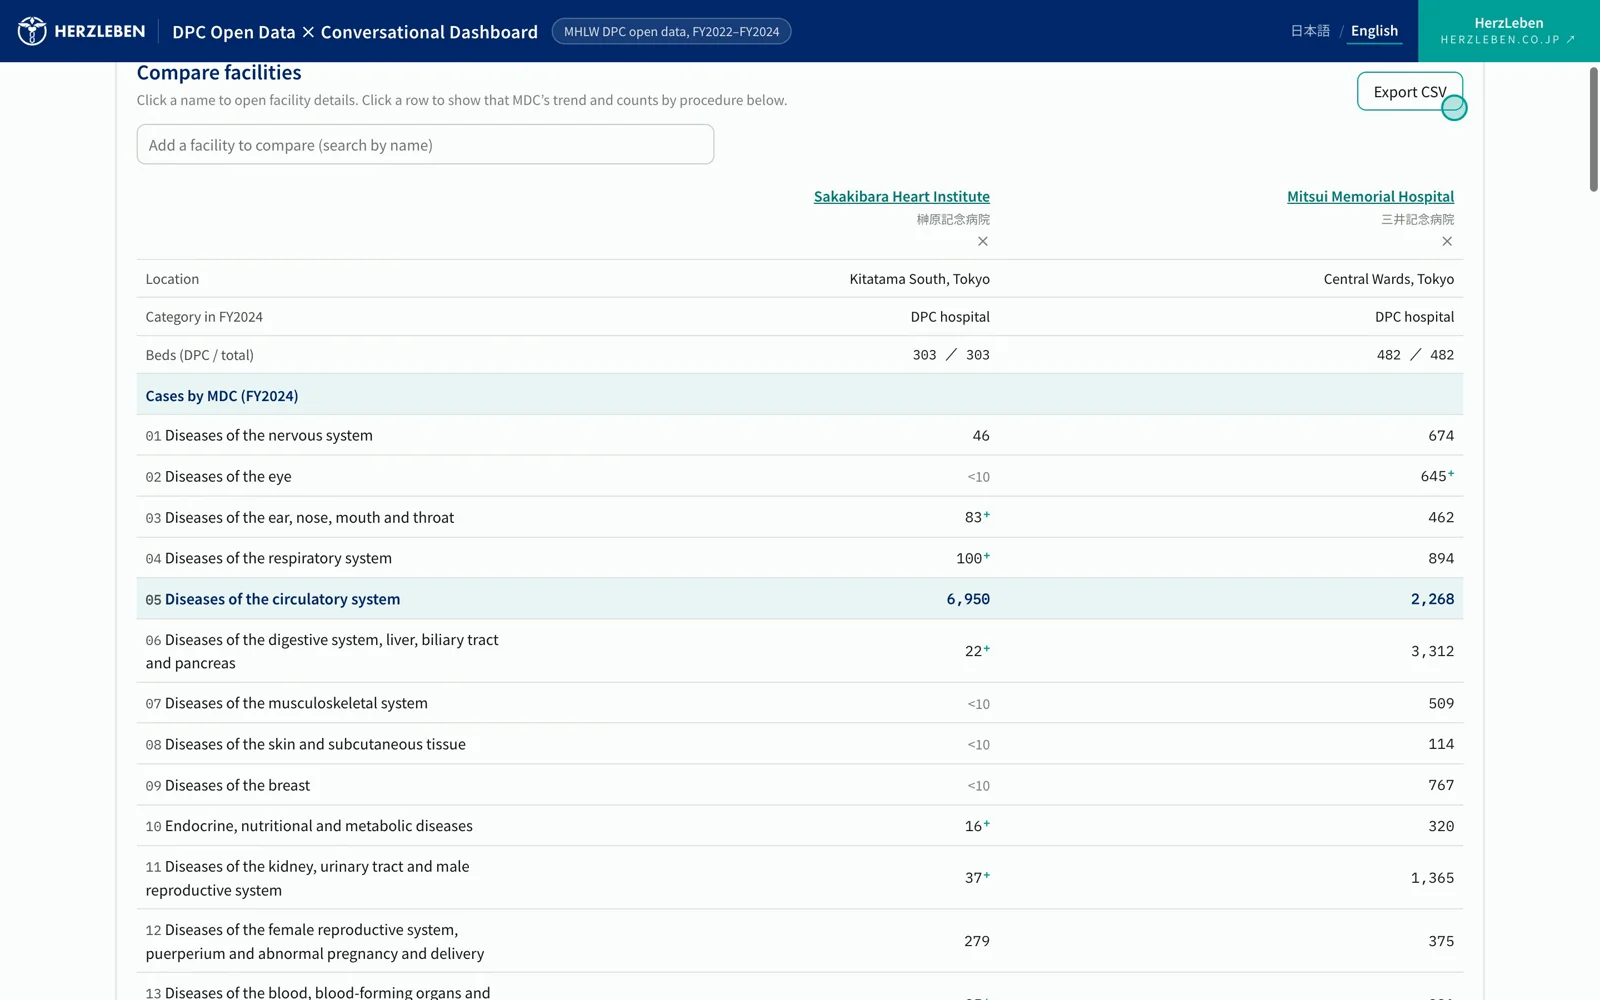
Hospital comparison: category, beds and cases by MDC for two or three hospitals 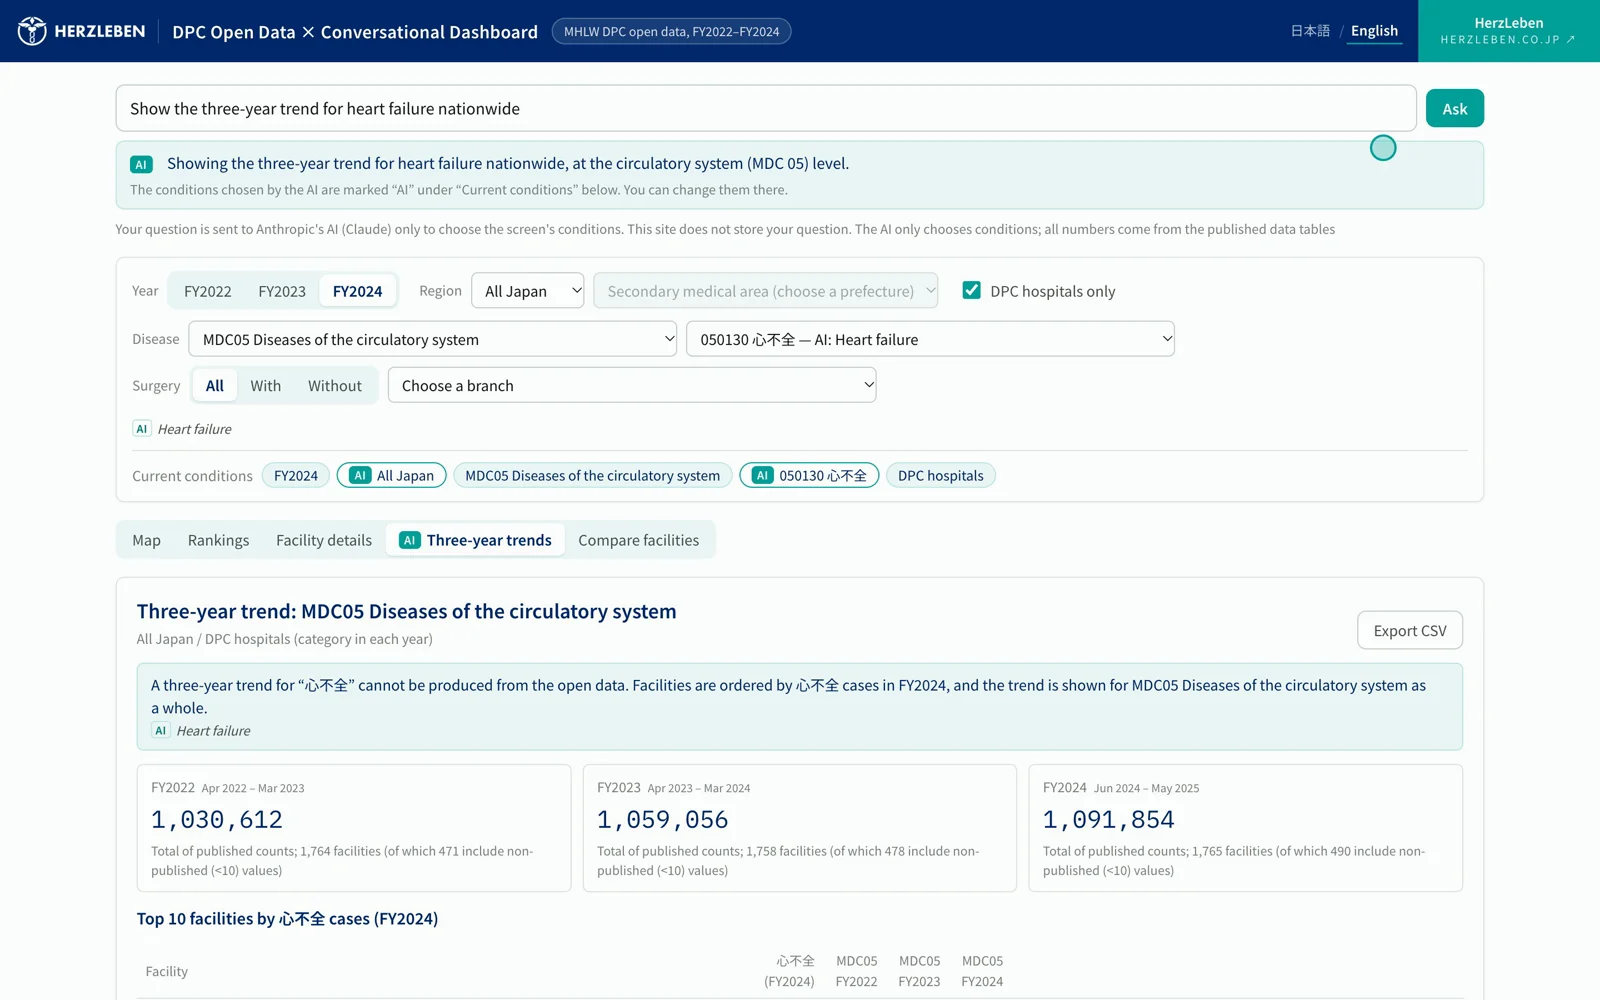
Three-year trend. When something cannot be produced from the open data, the top of the screen explains why, and the alternative view, once
Each condition the AI chose carries an “AI” mark in the “Current conditions” chips. If one is wrong, the viewer can fix it by hand on the spot, and the mark goes away from the condition they changed.
Names of diseases and procedures stay in Japanese, which is the official wording; the English shown beside them is a reference translation by AI.
3-1. Comparing regions
Ask “Compare PCI for acute myocardial infarction across secondary medical areas in Hokkaido,” and you get a ranking by secondary medical area. Values that are not published (fewer than 10 cases, or zero) are never added as zero. Regional figures are labeled as totals of published counts only, with the possible upper bound shown alongside.
3-2. When a question cannot be answered, it offers another view
“The three-year trend for heart failure nationwide” cannot be produced from the open data, because counts by disease are published only for FY2024. The AI does not invent numbers. Instead it chooses another view: order hospitals by FY2024 heart-failure cases, and show the trend for the circulatory system as a whole.
4. How it works — the AI only picks conditions
All the AI chooses is the conditions: which screen, and which year, region and disease. All it knows are the names and codes of diseases and regions. Case counts come from tables checked in advance. Because the AI is never given a single count, it cannot invent one.
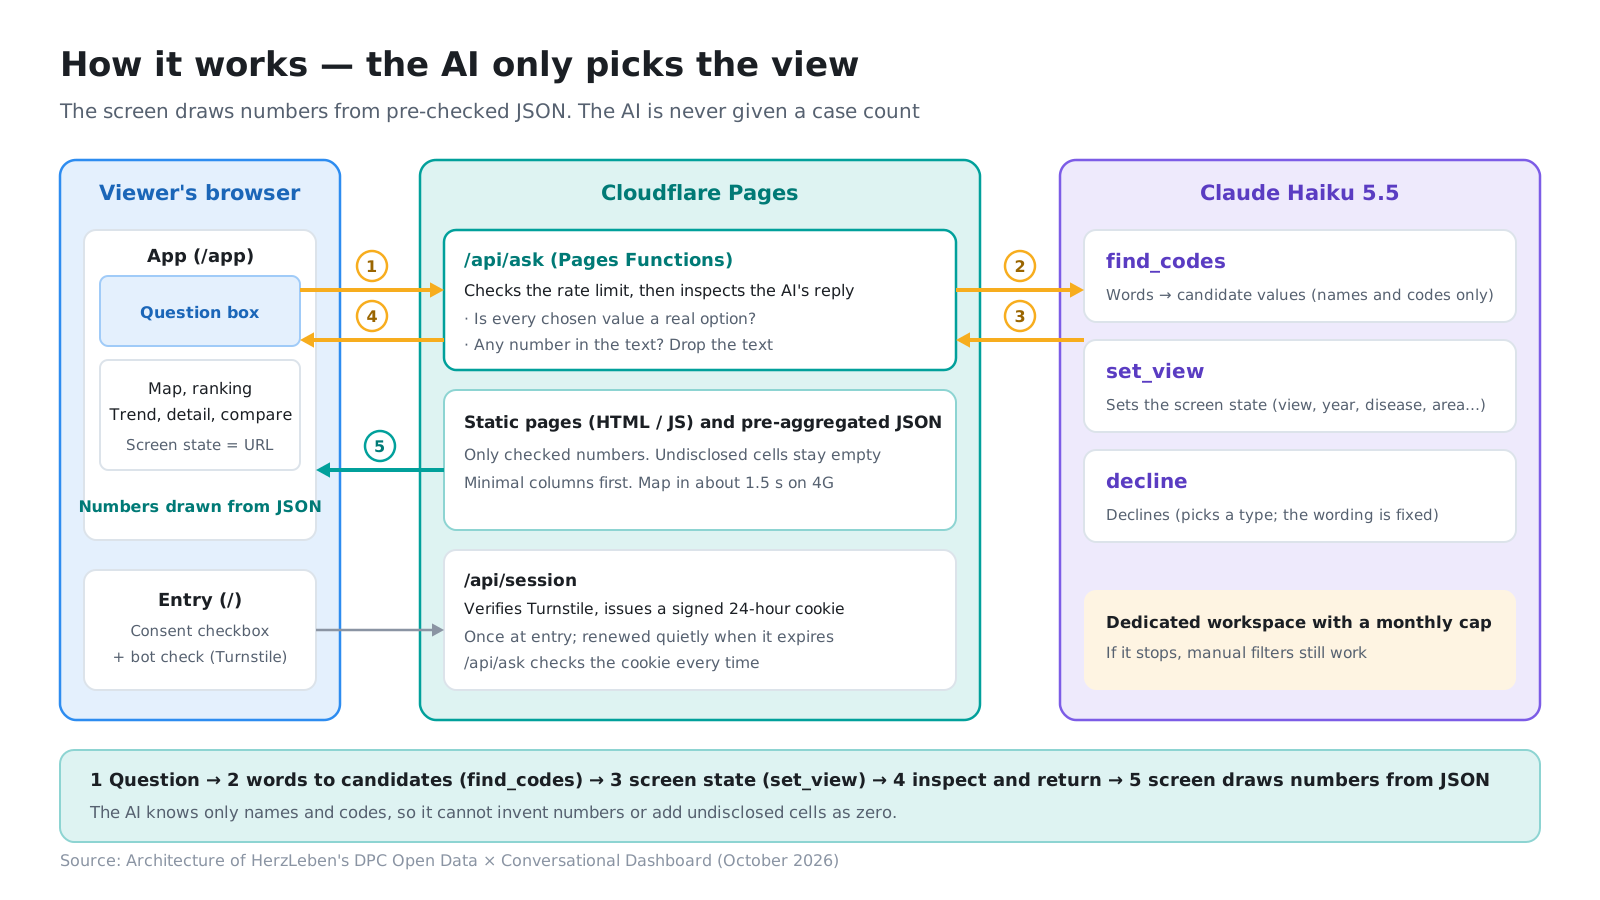
The app is static pages and pre-aggregated data on Cloudflare. Questions go to Claude Haiku 5.5, and the server checks the conditions it returns before the screen uses them. The AI has just three tools.
| Tool | Role | Returns |
|---|---|---|
find_codes |
Turns words into codes (“circulatory,” “heart failure,” “Sapporo” → values the screen can select) | Names and codes only (never counts) |
set_view |
Sets the screen (screen type, year, disease, region, hospital, and a short explanation) | The screen’s conditions |
decline |
Declines (unrelated questions, attempts to rewrite the instructions, medical advice and so on) | A fixed decline message |
On the server, we check that every chosen value is a real option on the screen and that no number appears in the explanation. If the explanation contains a figure such as “N cases,” it is a number the AI made up, so the whole explanation is dropped.
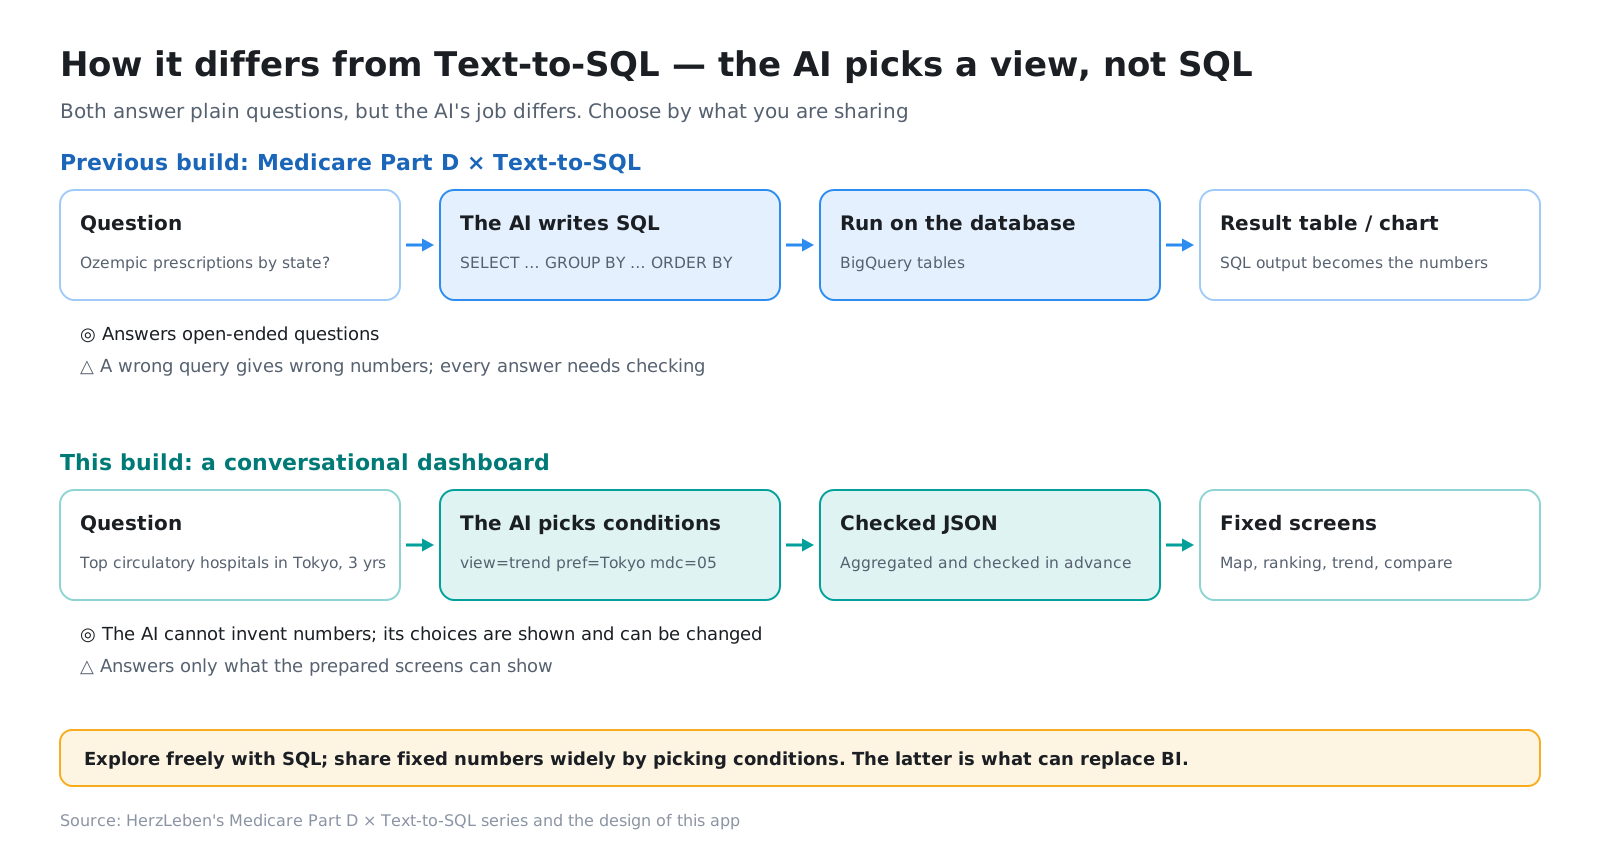
In our previous series, Medicare Part D × Text-to-SQL, the AI wrote SQL. That answers open-ended questions, but any mistake in the SQL turns straight into a wrong number. This approach only answers within the screens we prepared, and in exchange never entrusts the correctness of the numbers to the AI.
5. How it was built — an outline
We built the app with Claude Code. Claude Code took one stage at a time, and a person checked and made the calls at the end of each stage. Here are just the highlights of the four stages.
5-1. Preparing the data (Part 1)
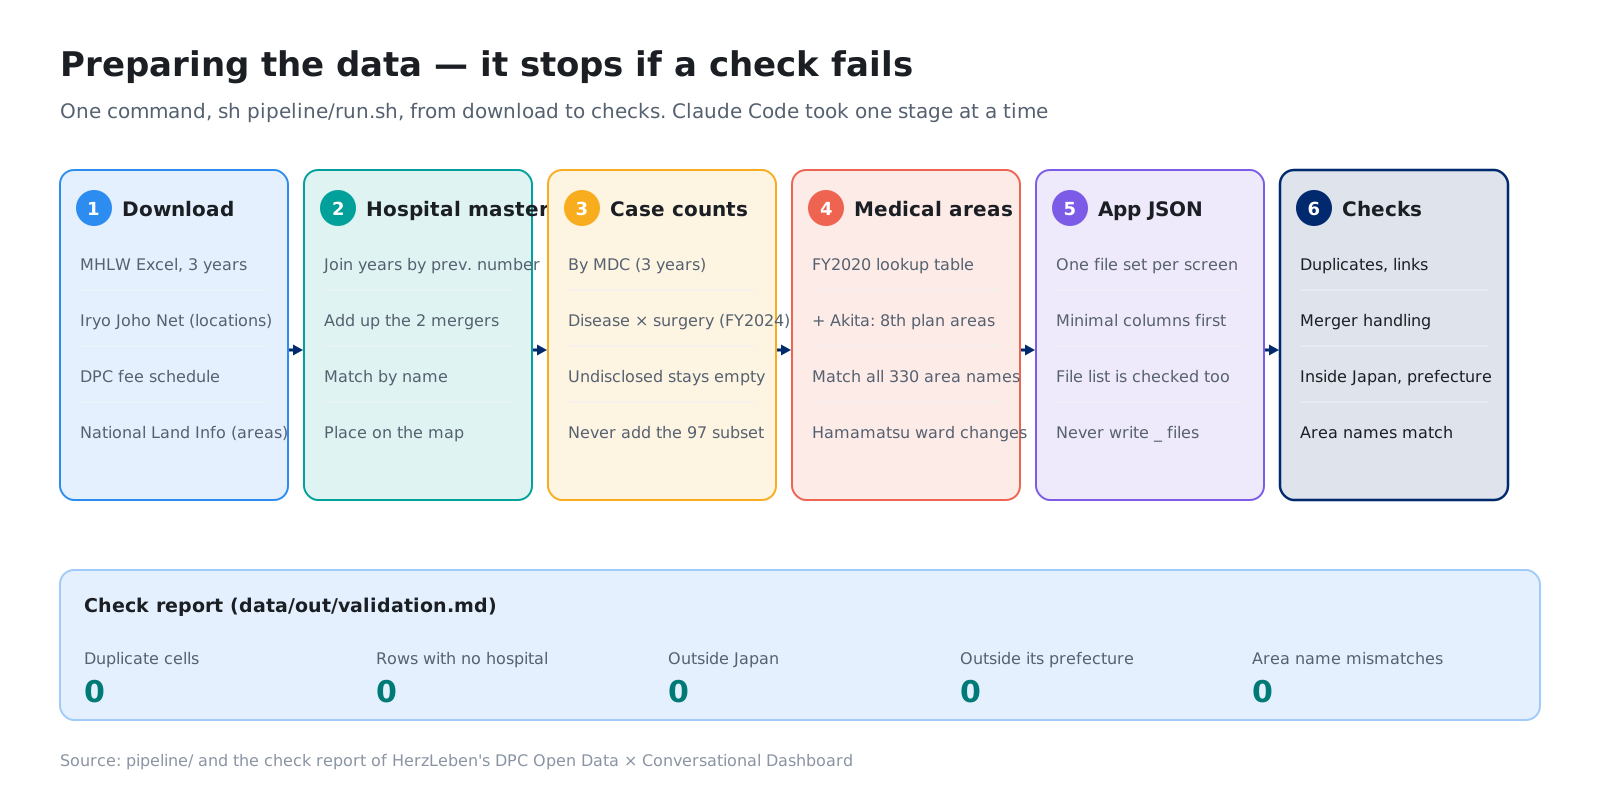
In the open data, hospital numbers are reassigned every year, hospital names are spelled inconsistently, and regional boundaries change partway through. The same happens with company data when the account master or sales territories change. Part 1 covers how we reconciled years, hospitals and regions, and why we stopped matching names at “good enough.”
5-2. Checking the numbers (Part 2)
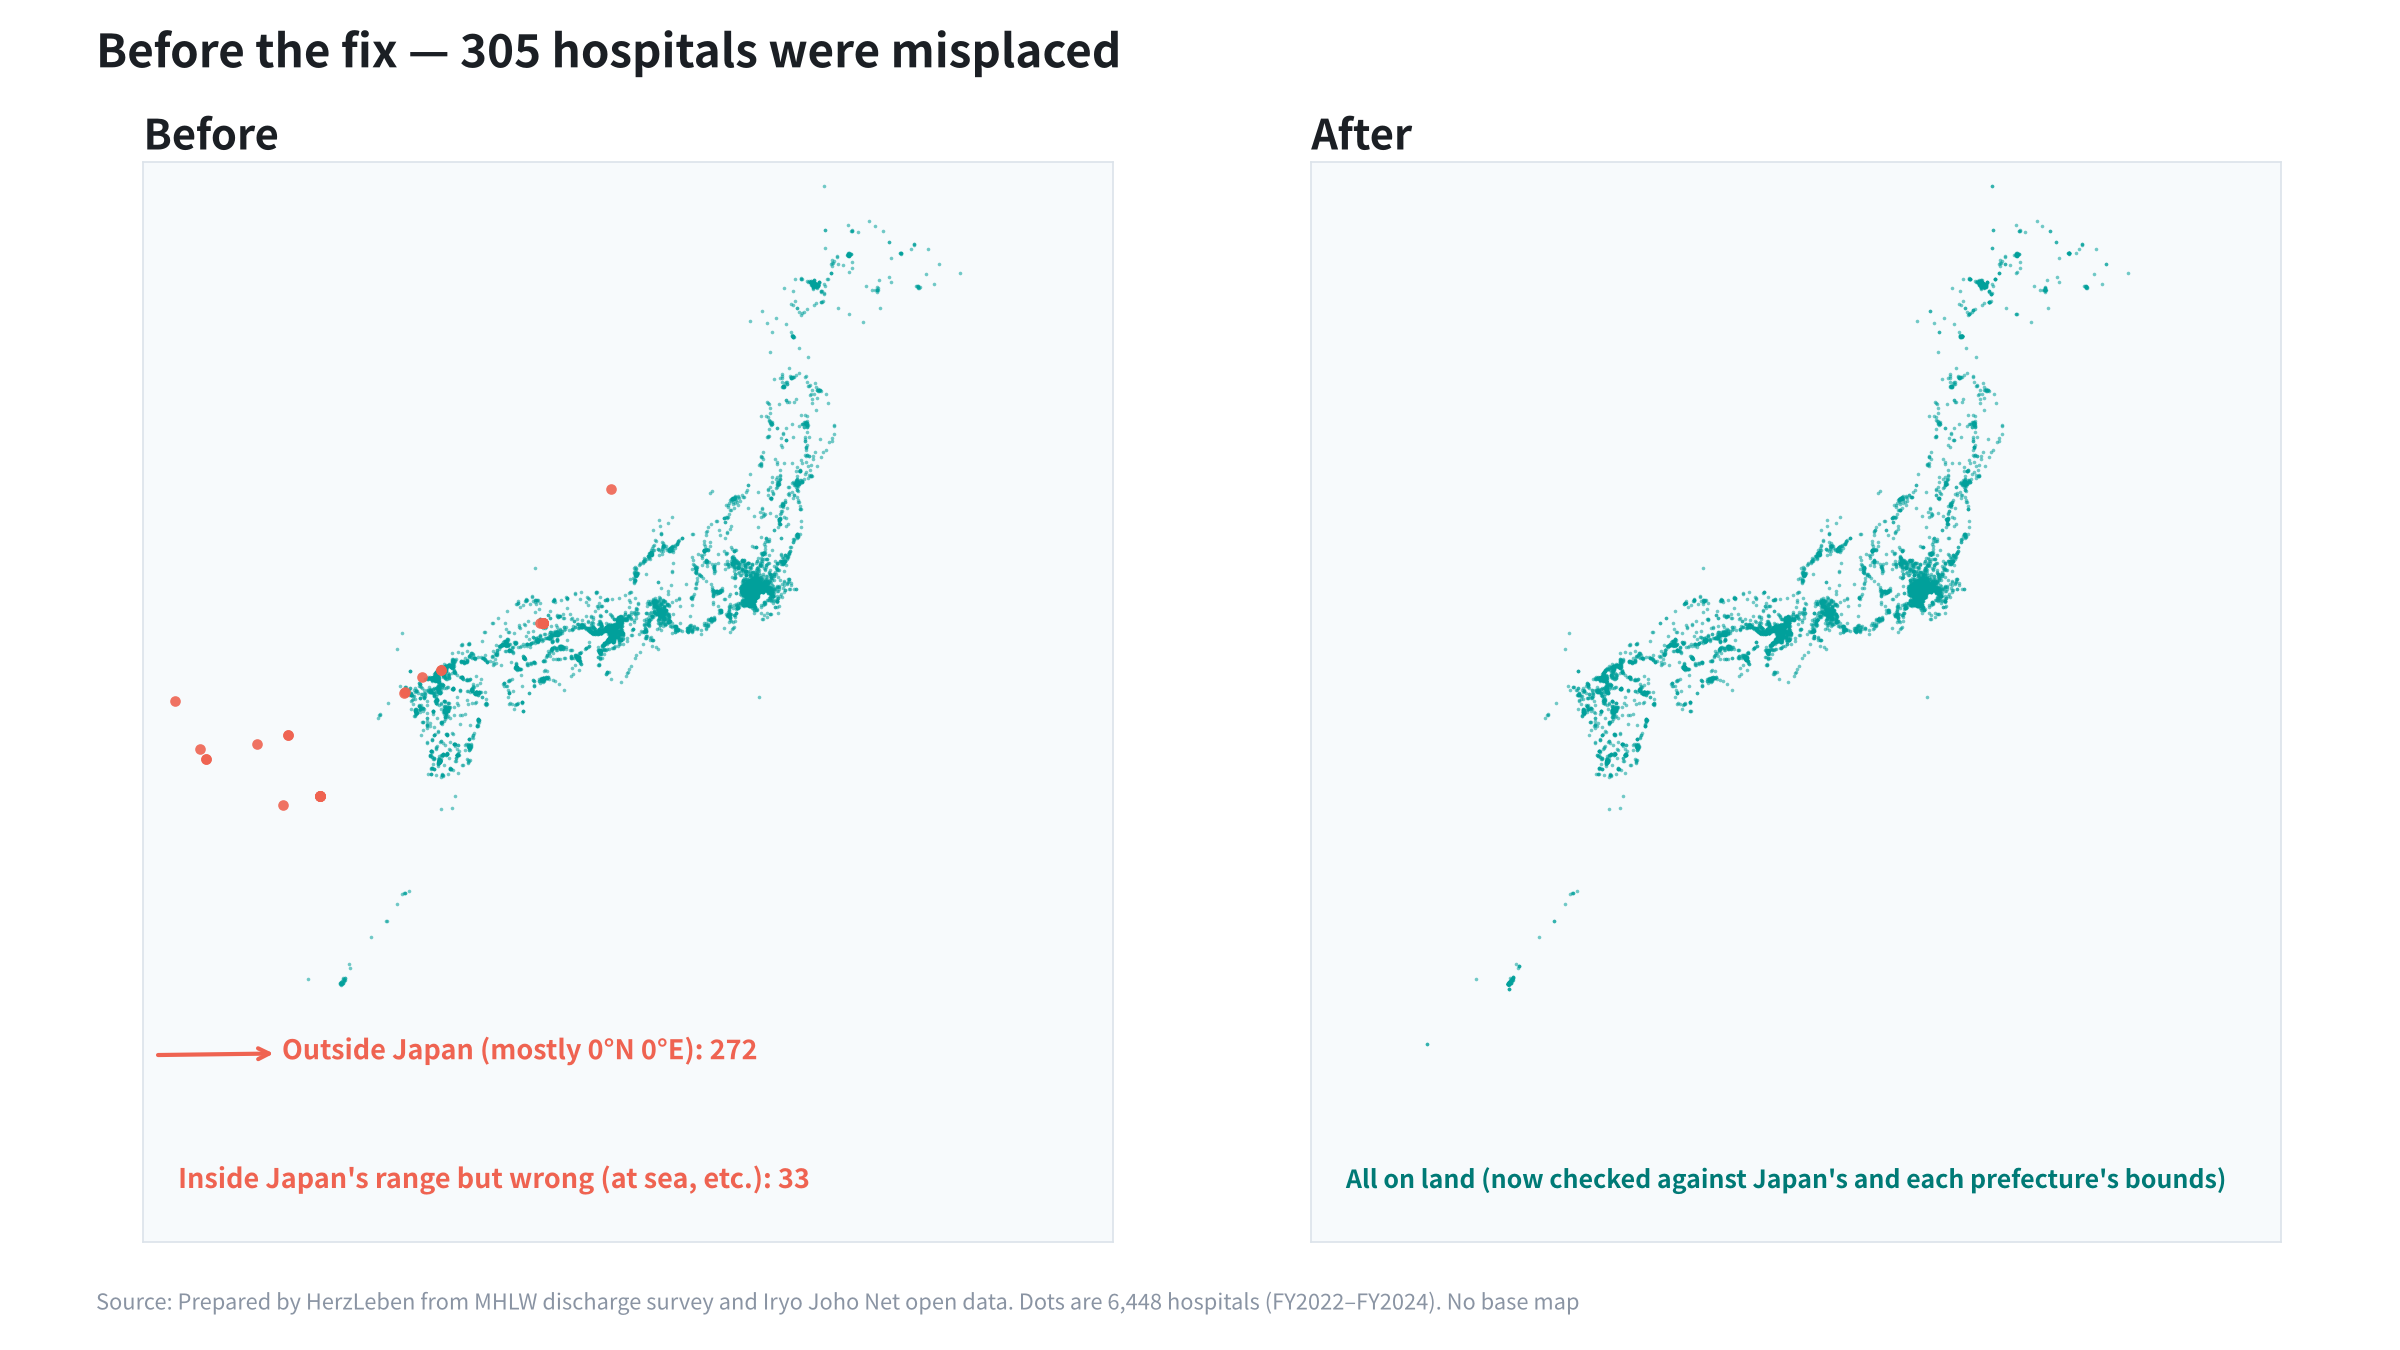
The count reconciliation and the automated tests had all passed, yet when we drew the map, 305 hospitals sat in the sea or outside Japan. It was an error invisible in the tables that only showed up once drawn. Part 2 covers how reconciliation and review keep the numbers correct.
5-3. Adding generative AI (Part 3)
Even with every automated test passing, a person reading the AI’s explanations found unnecessary caveats and conditions nobody had asked for. Where the same question produced varying answers, we stopped the variation with rules on the server rather than by asking nicely in the instructions. Part 3 covers how we decided what to leave to the AI.
5-4. Publishing and running it (Part 4)
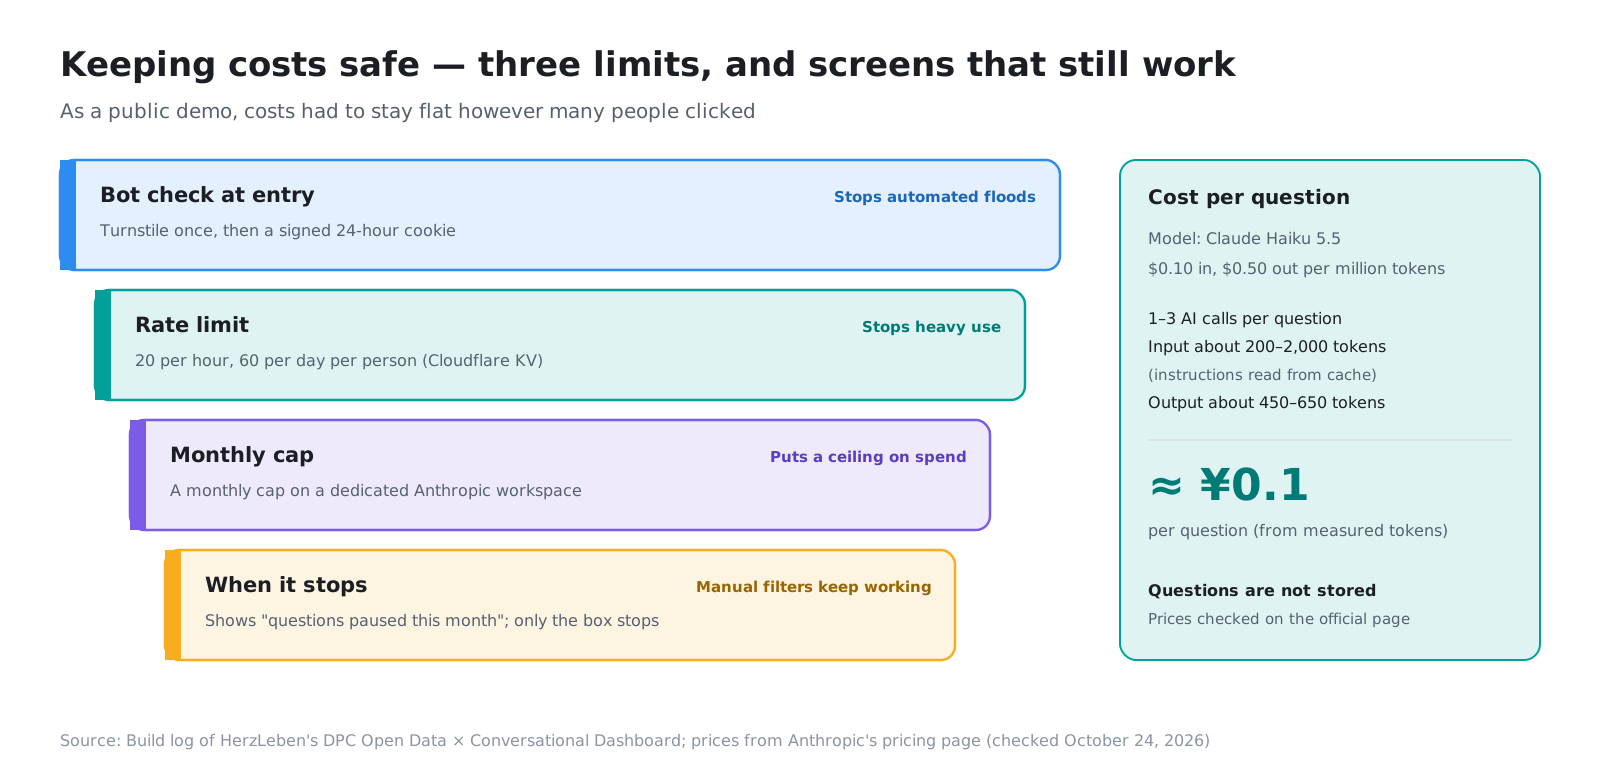
Because this is a public demo that anyone can use, costs are protected three ways, with a bot check, rate limits and a monthly cap, and the screens for choosing conditions by hand keep working even when the cap is reached. Secrets such as API keys were entered by a person, not by Claude Code. Part 4 covers how cost and security are managed.
6. Applying it to in-house BI
The same build carries over directly to in-house BI. Picture replacing your current BI dashboards like this:
- Deliver fixed metrics (by area, by product, monthly) to sales and field teams with just a URL, without licenses
- Answer questions like “Which accounts in this area grew since last month?” by turning them into screen conditions
- Let only the checked aggregation produce numbers, and keep the AI as a guide to the screens. Responsibility for correct numbers stays with the aggregation, just as with today’s BI
- Keep the screens and the aggregation in code, so that even after the builder leaves, you can read and fix them together with Claude Code
7. Summary
- We tested, with Japan’s DPC open data, whether the many BI dashboards a company has can become AI dashboards you can talk to
- No licenses are needed, and a URL shares the exact screen. Only published figures are shown, and the AI costs about 0.1 yen per question
- The AI only picks the screen’s conditions and never touches a count. What it can replace is the part that delivers numbers for fixed questions
- Claude Code built it one stage at a time, with a person checking at each step. The details are in Parts 1 to 4
Next step
The app is live at dpc.herzleben.co.jp. Try asking it something, and check which conditions the AI chose in the “Current conditions” chips.
This time, we tried it on open data. If you would like to turn your in-house BI into a tool powered by generative AI, let us know through the contact form.
Sources
- MHLW, Results of the FY2024 Survey for the Evaluation and Verification of DPC: Discharge Survey (published March 30, 2026; data replaced June 30, 2026). https://www.mhlw.go.jp/stf/shingi2/newpage_00203.html
- MHLW, Results of the FY2023 Survey on the Impact of DPC Introduction: Discharge Survey. https://www.mhlw.go.jp/stf/shingi2/newpage_00137.html
- MHLW, Results of the FY2022 Survey on the Impact of DPC Introduction: Discharge Survey. https://www.mhlw.go.jp/stf/shingi2/newpage_39119.html
- MHLW, DPC electronic fee schedule, FY2024 fee revision (updated May 20, 2025). https://www.mhlw.go.jp/stf/seisakunitsuite/bunya/0000198757_00008.html
- MHLW, Iryo Joho Net open data (as of June 1, 2026). https://www.mhlw.go.jp/stf/seisakunitsuite/bunya/kenkou_iryou/iryou/newpage_43373.html
- MLIT, National Land Numerical Information: Medical Areas, FY2020 edition (CC BY 4.0). Akita Prefecture regrouped into the three areas of the 8th Medical Care Plan
- Map: Geospatial Information Authority of Japan, GSI Tiles (pale map)
- Anthropic, Pricing (Claude Haiku 5.5, checked October 24, 2026). https://www.anthropic.com/pricing
- Tableau is a trademark of Salesforce, Inc., and Power BI is a trademark of Microsoft Corporation. This post is not affiliated with or endorsed by either company
- The figures and screens in this post were prepared by HerzLeben Inc. from the sources above; they were not produced by the Japanese government