
Claude Code × Medical Application
[Claude Code] Turning an In-House BI Dashboard into an AI Dashboard, Part 2: Checking the Numbers — Keeping Them Correct with Checks and Reviews
1. Introduction — numbers that look right but are wrong
The scariest thing in an in-house BI dashboard is not a screen that fails to load. It is a number that looks right but is wrong. A broken screen gets noticed at once. A plausible number gets pasted into meeting slides and used to make decisions.
Part 1 covered how we reconciled mismatches in years, hospitals and regions. Part 2 is about how we checked the numbers in that reconciled data.
The conclusion first: most of the errors we found during the build were still there after the automated tests and the count reconciliation had passed. We found them when we drew a map, read a table’s definition, lined up changes over time, or when a person looked at the screen.
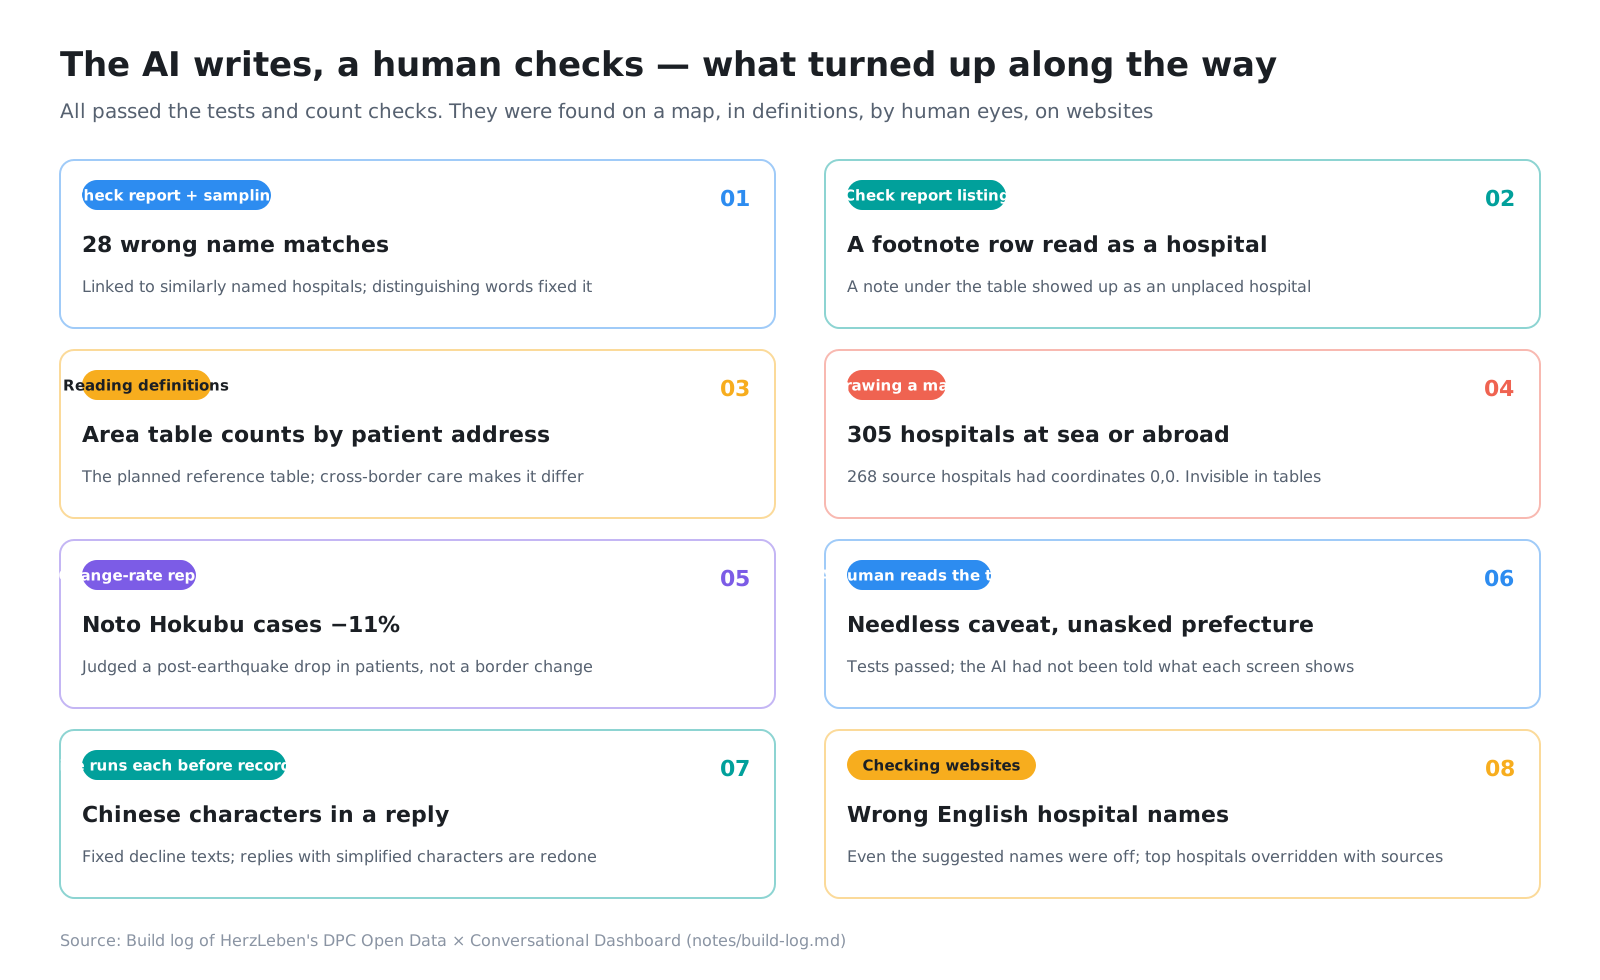
Here is how this post is organized.
- Introduction (this section)
- Reconciliation is something you grow
- Draw it — 305 hospitals in the sea
- Read the definition — the medical-area table counts by patient address
- Look at the changes — Noto Hokubu −11%
- Spot-check and look at the real thing
- Rules for presenting numbers
- Finding the errors that survive passing tests
- This post’s harness / Summary
2. Reconciliation is something you grow
2-1. A pipeline that stops
Data preparation runs end to end, from download to checks, with a single command, sh pipeline/run.sh (Part 1). The final reconciliation step (validate.py) writes a reconciliation report (data/out/validation.md). If even one stopping check fails, it stops without writing the app data.
Because it is built to stop, data that fails reconciliation never reaches the screen, even when Claude Code handles a stage. Claude Code itself works on the understanding that “my job is done when the checks pass.”
2-2. Each time you find an error, add one check
The checks were not all there from the start. Each time we found an error, we added one check so that the same error could never pass again.
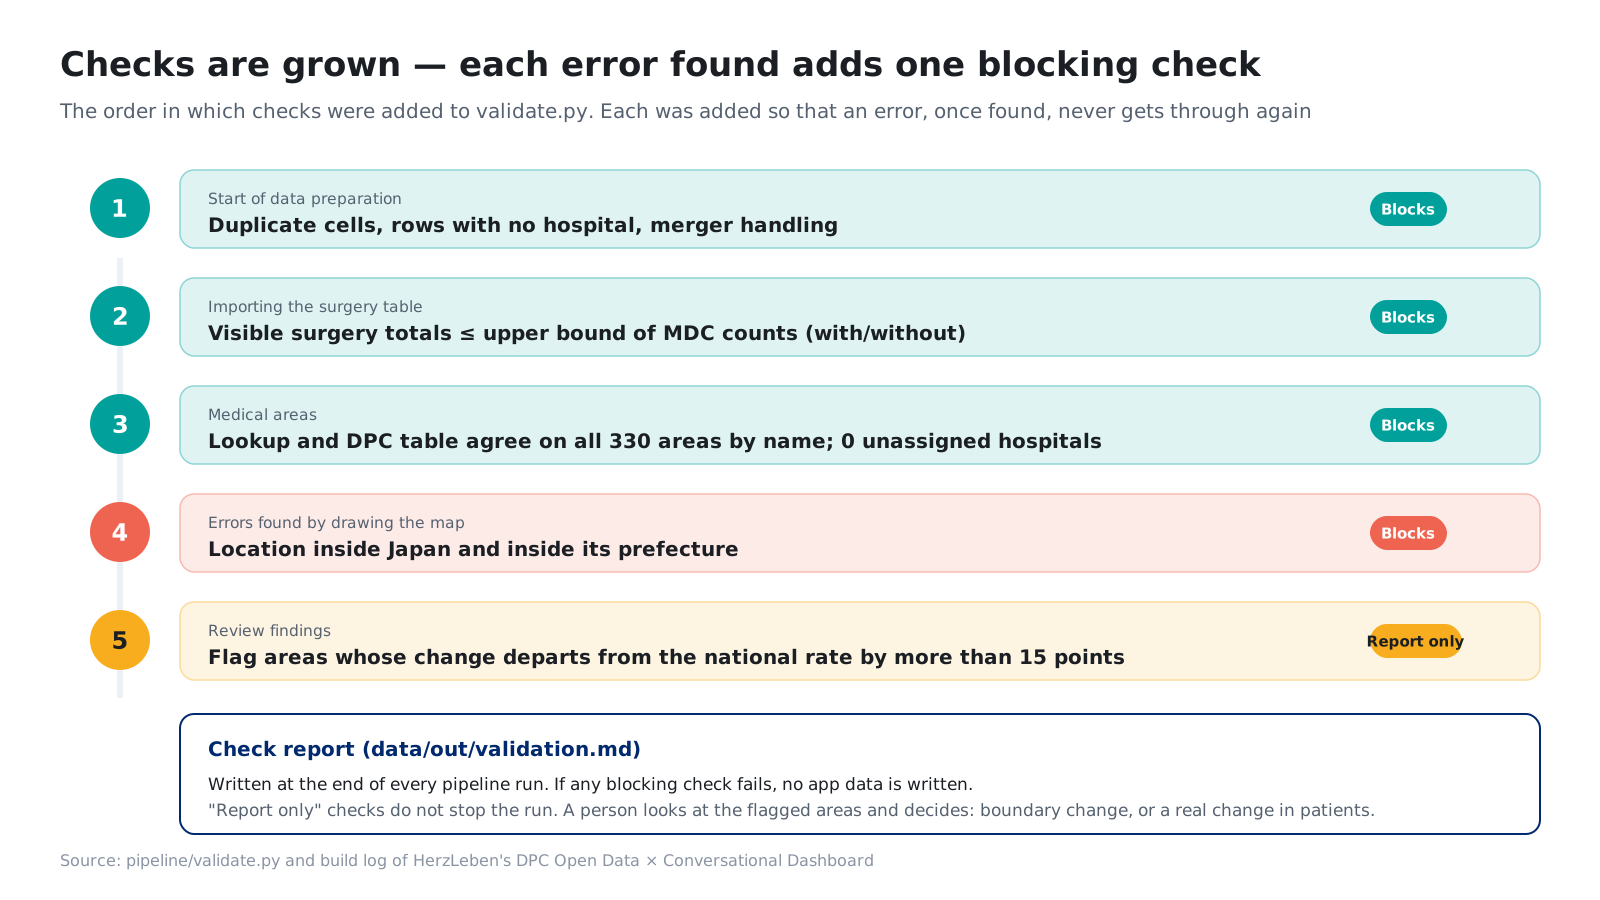
For the map error in section 3, we added the check in this order.
- When you find an error, add the check first
- Run it against the data before the fix, and confirm it catches exactly that error
- Then fix how the data is built, and confirm the check passes
Skip step 2, and you may add a check that catches nothing and feel safe anyway. With the map error, step 2 showed us that one check was not enough.
3. Draw it — 305 hospitals in the sea
3-1. We did not notice in the tables
We built the map and ranking screens, and the first time the map came up, hospital circles appeared over the East China Sea and mainland China.
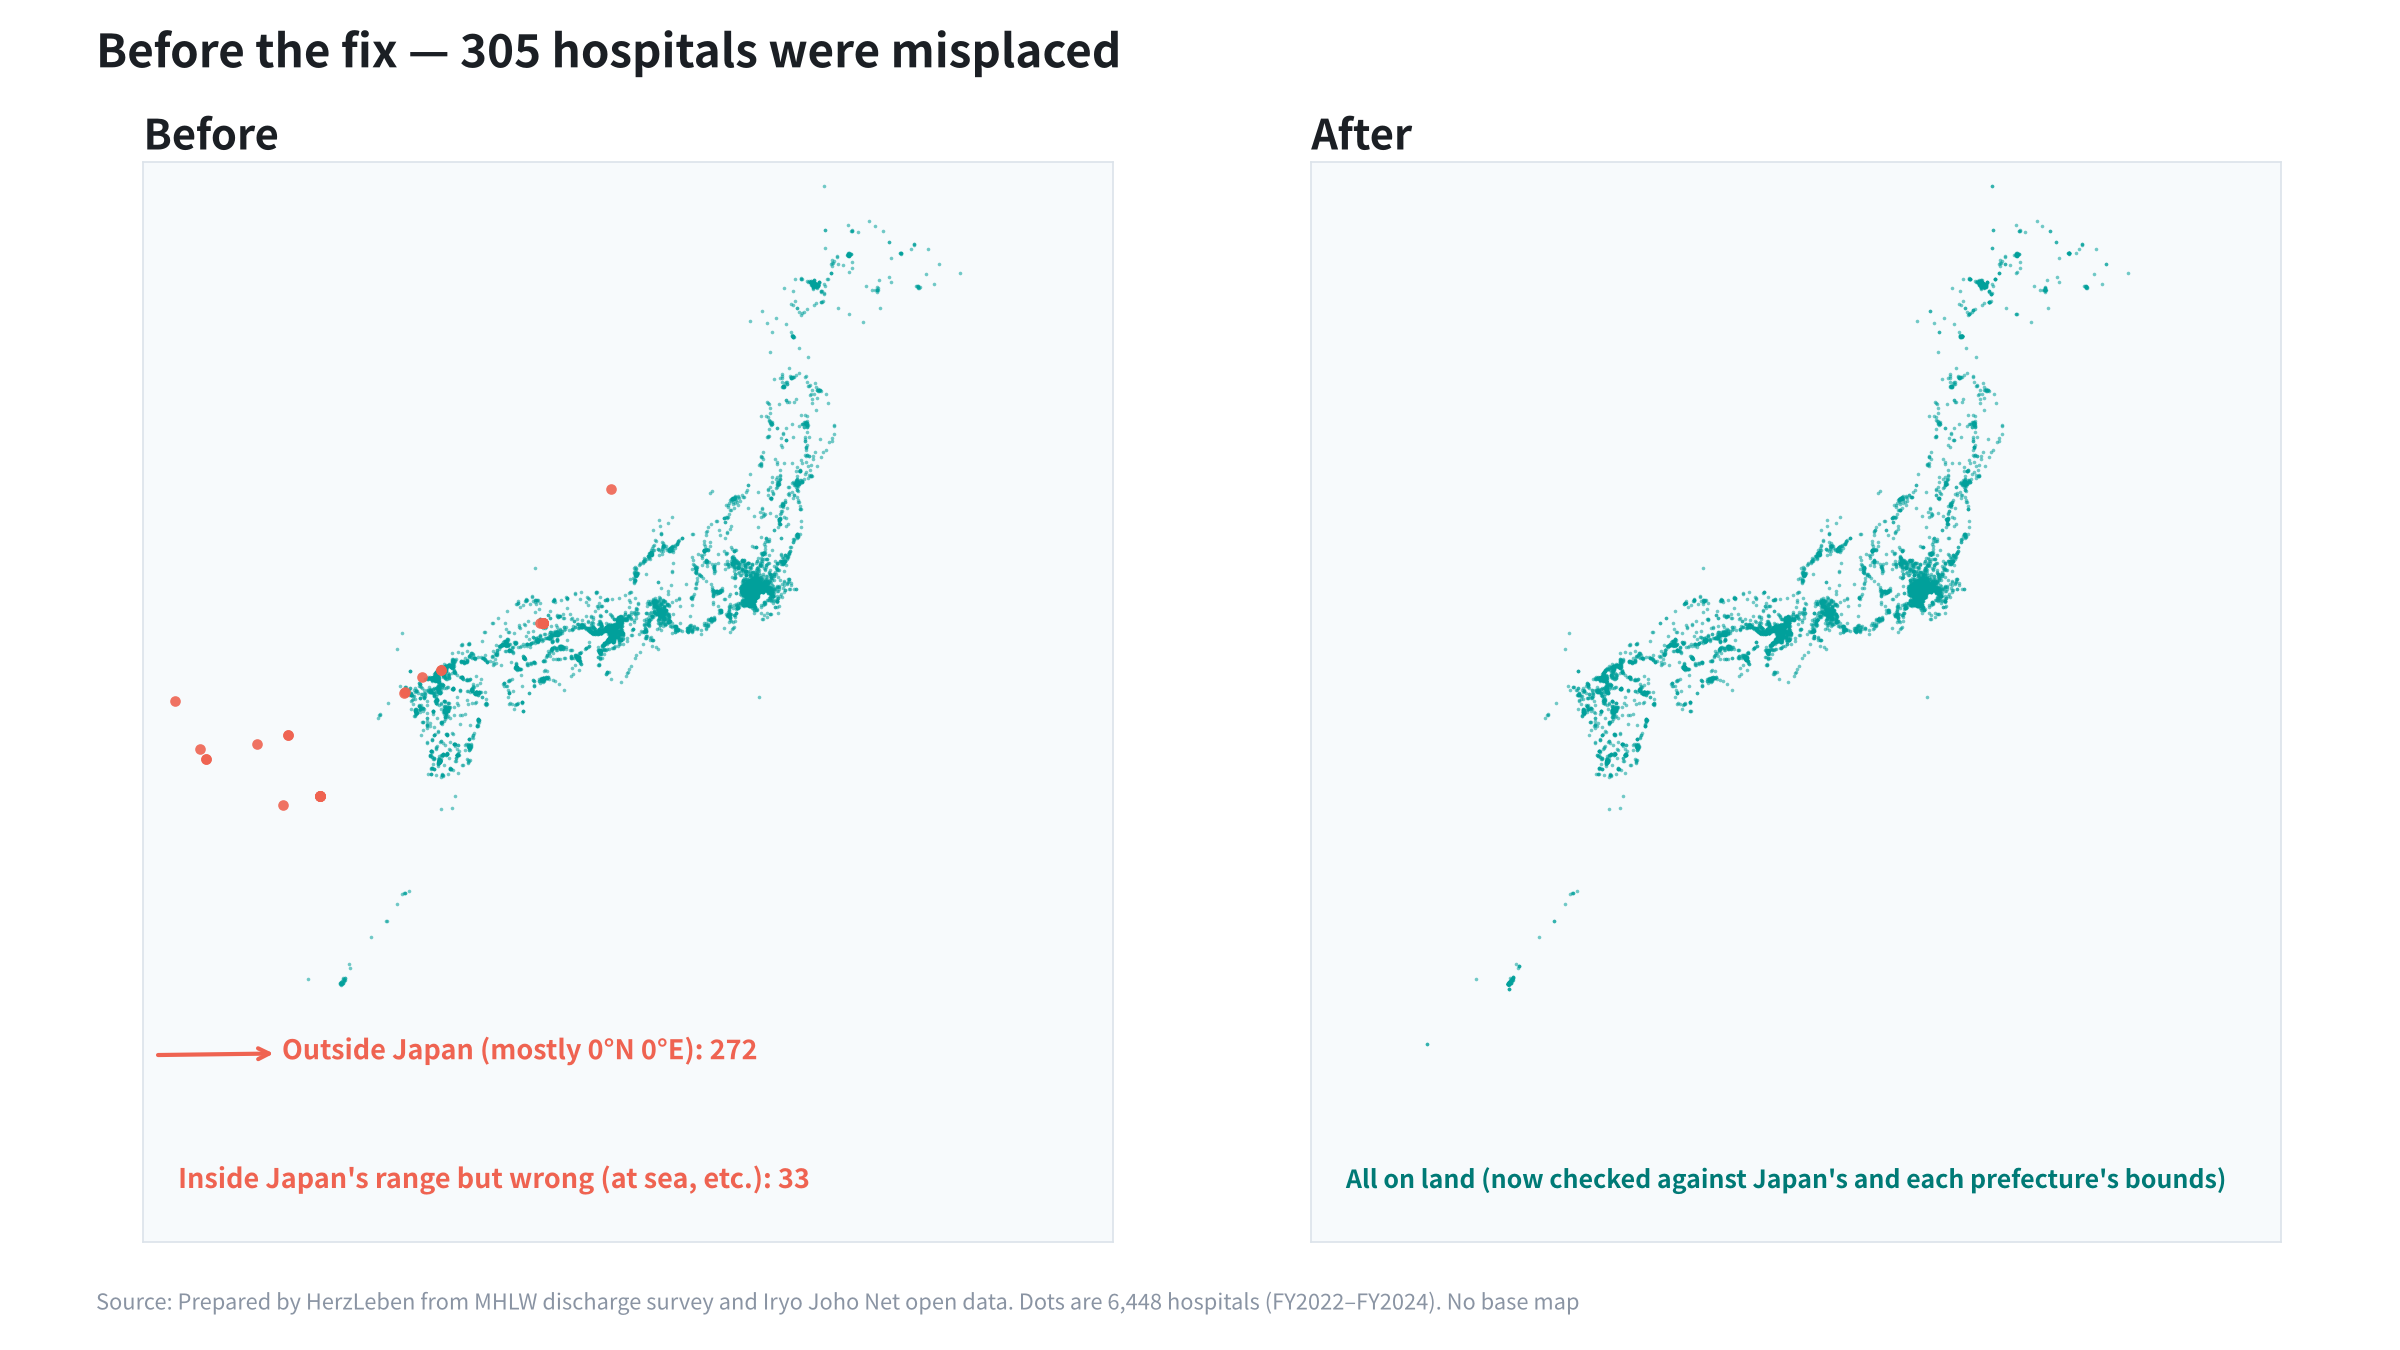
The cause: the Iryo Joho Net (Navii) data we borrowed hospital locations from had 268 hospitals with coordinates of “0.0, 0.0” (147 in Hokkaido, 31 in Okinawa and so on), and we had used them as they were. It affected 305 hospitals. Of these, 272 were outside Japan (the matched hospital’s coordinates were 0, or they used a municipality’s representative point that was averaged with zeros). The other 33 were inside Japan’s bounds but in the wrong place (for example, Kagoshima City’s representative point landed in the sea).
The count reconciliation had passed. The only location check was a breakdown of “which rule assigned the location.” It was an error we did not notice in the tables and only found once we drew the map.
3-2. The fix also needs judgment
Simply “dropping hospitals with zero coordinates” would remove them as name-matching candidates, which could link a hospital to a different hospital in the same municipality. So we kept them for name matching but stopped using them as coordinates. After the fix, we also confirmed that not a single matching result changed.
3-3. One check was not enough
To prevent a recurrence, we added a “within Japan’s bounds” check and, following the steps in 2-2, ran it against the data before the fix. It caught only 272. It missed the 33 misplaced hospitals inside Japan’s bounds. Adding a “within the bounds of the hospital’s prefecture” check caught exactly the 272 and the 33.
With company data too, for columns that rarely look odd in a table, such as addresses, coordinates and dates, drawing them on a map or a time series is the fastest way to check.
4. Read the definition — the medical-area table counts by patient address
At first, we planned to use the DPC “Patients by medical area and MDC” table as the reference for hospital counts summed by medical area. The idea was: if the sum by hospital location matches the table, it is correct.
But when we read the table’s definition in the tabulation-conditions document, it counted by patient address. Because patients cross prefecture lines for care, the table is supposed to differ by exactly that amount.
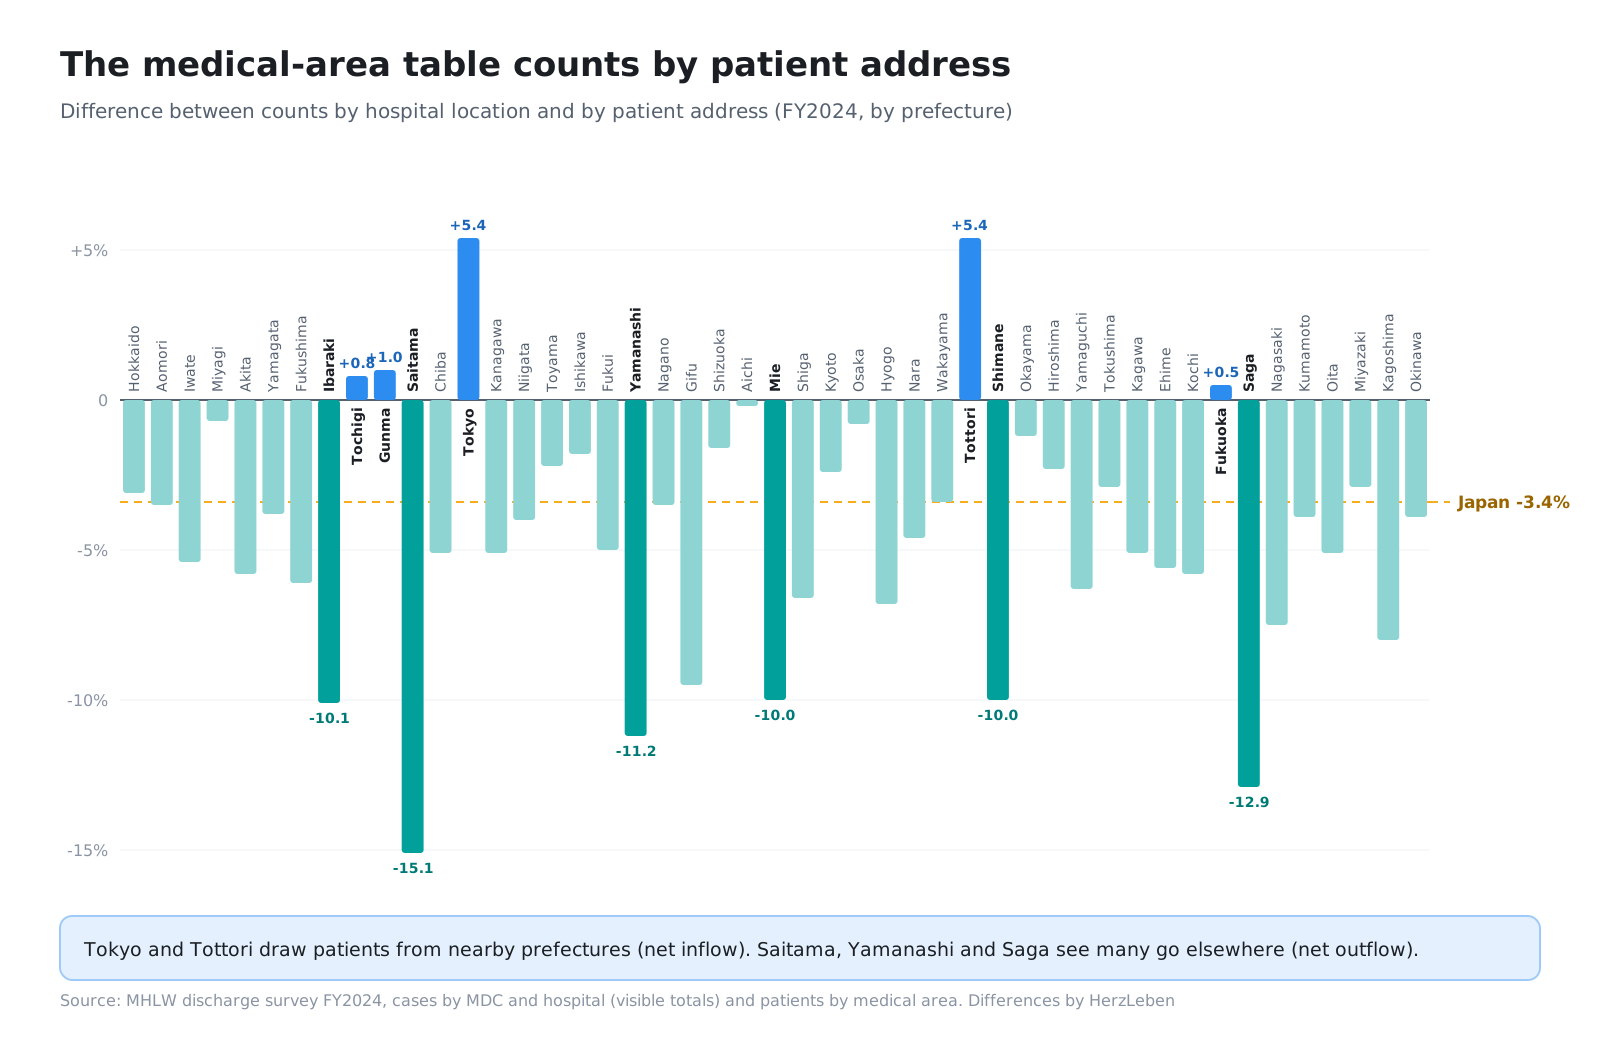
We dropped it as a reference and only put the per-prefecture differences in the reconciliation report for information (FY2024: Saitama −15%, Tokyo +5% and so on). Had we used it as the reference, we might have broken correct data while hunting for the cause of the “mismatch.”
In company terms, this is like asking whether “sales” is counted at shipment or at invoicing, or whether “number of customers” is counted per contract or per site. Before reconciling, read what the reference counts and in what unit.
5. Look at the changes — Noto Hokubu −11%
As mentioned in Part 1, a review pointed out that “even when a medical area keeps its name, its boundaries can change.” Because we match areas by name, the checks would still pass after a boundary change.
So we added a check that compares each medical area’s rate of change in cases between years and reports any area that differs from the national rate by more than 15 percentage points.
- FY2022 → FY2023: national +6.3%. No areas with a large difference
- FY2023 → FY2024: national +4.4%. One area with a large difference: Noto Hokubu, Ishikawa Prefecture, −11%
This is the year after the Noto Peninsula Earthquake (January 2024). We judged it to be a drop in patients, not a boundary change, and left the data untouched.
The machine only reported the fact that “this differs.” A person decided what it meant. That is why we did not make it a stopping check.
6. Spot-check and look at the real thing
6-1. Spot-check with numbers you know
Even after the checks passed, we added spot-checks at each stage, comparing numbers against the original tables.
- Hospital matching: sampled 60 hospitals and confirmed none were mixed up
- Counts: Sapporo Medical University’s counts by MDC, and brain tumor counts and length of stay by surgery, matched the original tables
- Clinical sense: the top hospitals for percutaneous cerebral angioplasty in cerebral infarction and for colectomy in colon cancer are specialist hospitals. Sakakibara Heart Institute has many congenital cases (MDC14)
The last item cannot be confirmed by reconciliation. It is about whether someone who knows the field sees anything odd. In in-house BI, it is the moment when someone in sales or in the field says, “This customer can’t be ranked here.”
6-2. A note row had become a hospital
The reconciliation report also lists hospitals that could not be placed on the map. Looking through that list, we found a row whose hospital name was a sentence from a note. We had been reading the note below the hospital list table as a hospital. Its count was zero, so it had no effect on the totals, and the checks had passed. It was an error found only when a person read through the list.
6-3. Look at the real screen
At the point where each screen was done, we reviewed it while looking at the real screen in Claude in Chrome, and fixed five things.
| What we found | What we fixed |
|---|---|
| Mainland China filled the left half of the map, and place names were in Chinese, Korean and Russian | Switched to the GSI Tiles pale map. Put the top 10 hospitals to the right of the map and fitted the map to Japan’s tall shape |
| Hospital names were long, full official names | Used short names. Of 6,448 hospitals, 4,499 got shorter display names |
| Undisclosed values were written inconsistently across tables, as “under 10 or 0” or “-” | Both now show “<10” |
| “Suppressed” is internal jargon to readers | On screen: “undisclosed (<10)” |
| Too much space between columns in the comparison table | Set the label column to 30% and spaced the hospital columns evenly |
While checking phone widths, we also noticed that headless Chrome was rendering at a minimum width of 500px, so specifying 390px was not actually being checked. We rechecked using a method that lets us set the device width. Whether the tool is measuring correctly is also something to check.
7. Rules for presenting numbers
Even when the numbers themselves are correct, the way they are shown can mislead. Not adding undisclosed values (fewer than 10 cases, or zero) as zero is a given. On top of that, we set three rules for the screens.
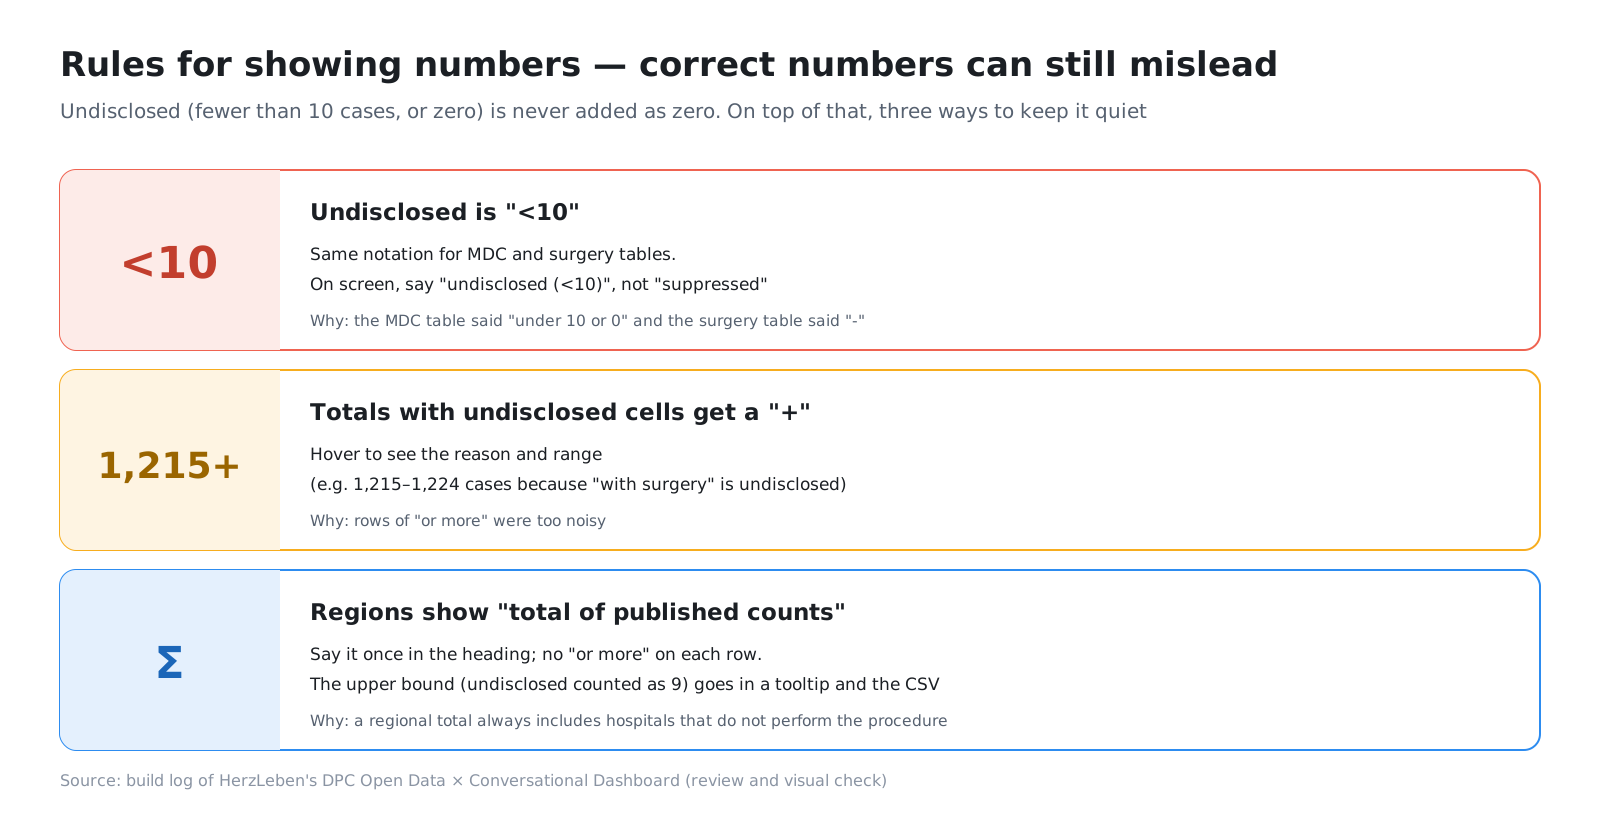
The third rule, “regions show the total of published counts,” came from a point in the build where our expectation turned out wrong. At first, we thought that adding up surgery branches mixed in undisclosed values and increased the number of “at least” labels, so narrowing the demo question to a single surgery would reduce them. But even after narrowing, in the comparison of Hokkaido’s medical areas, Sapporo’s 1,067 cases still showed as “at least,” because 16 of its 44 hospitals were undisclosed.
The cause was not adding up branches. It was that a regional total always includes hospitals that do not perform that surgery (fewer than 10 cases, or zero). Claude Code reported this and asked for a decision. A person decided: “State it once in the heading, and drop the per-row ‘at least.’ Show the upper bound in the tooltip and the CSV.”
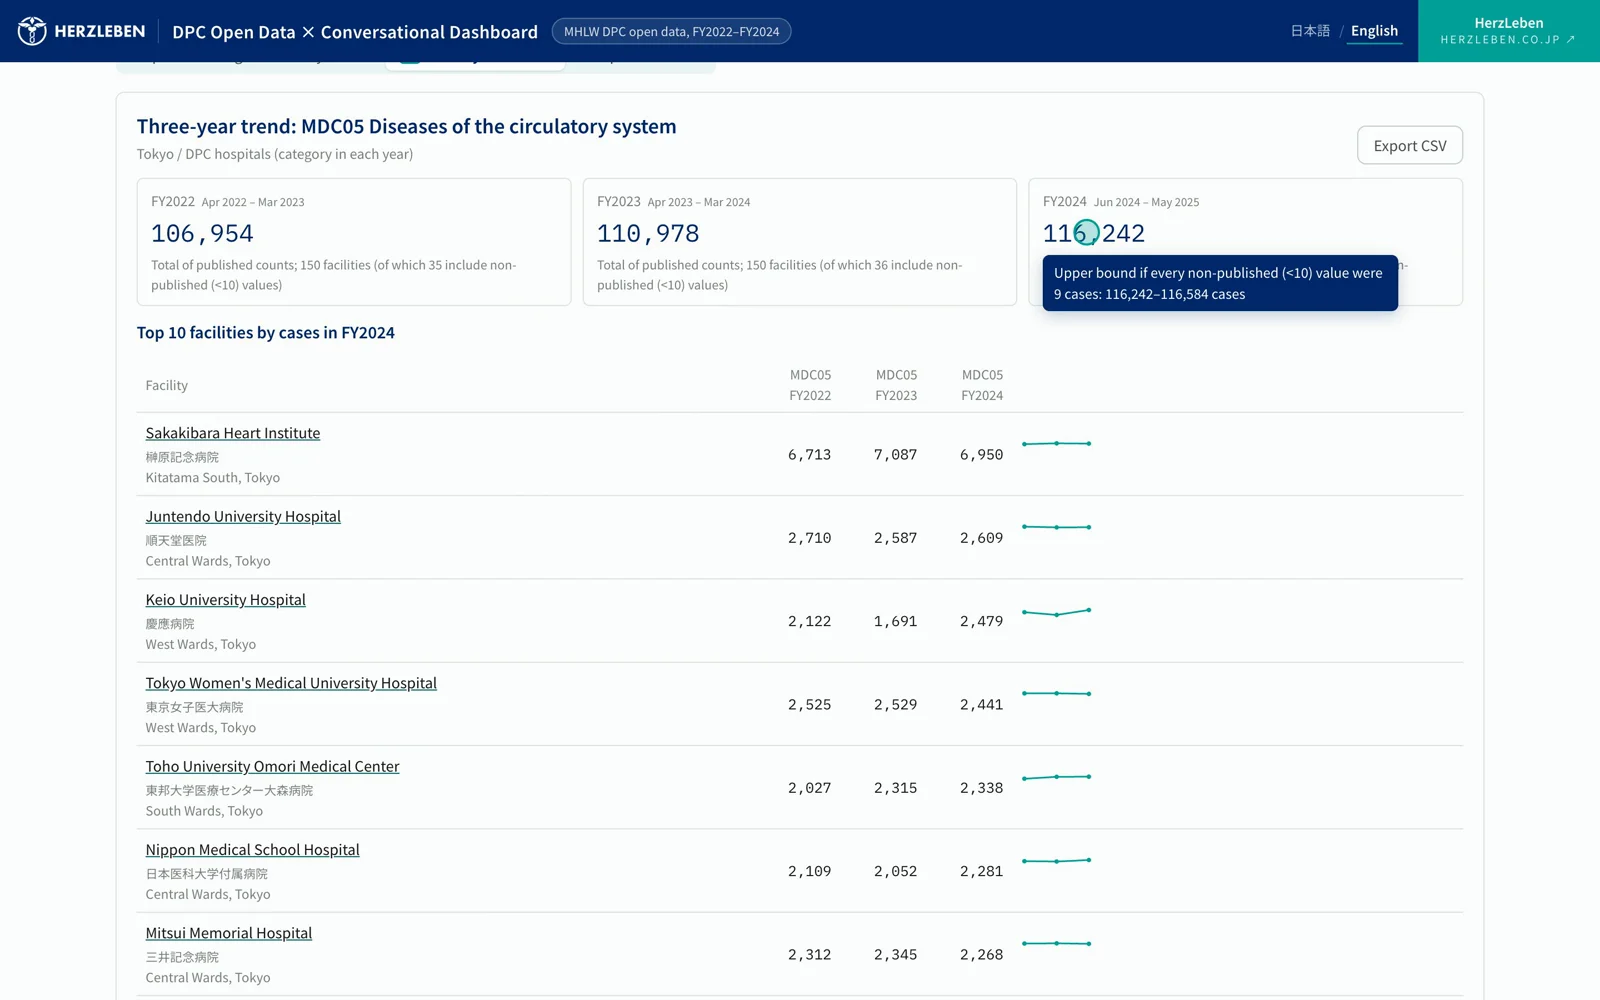
The trend screen. Hovering over the total of published counts shows the upper bound if every undisclosed value were 9 cases 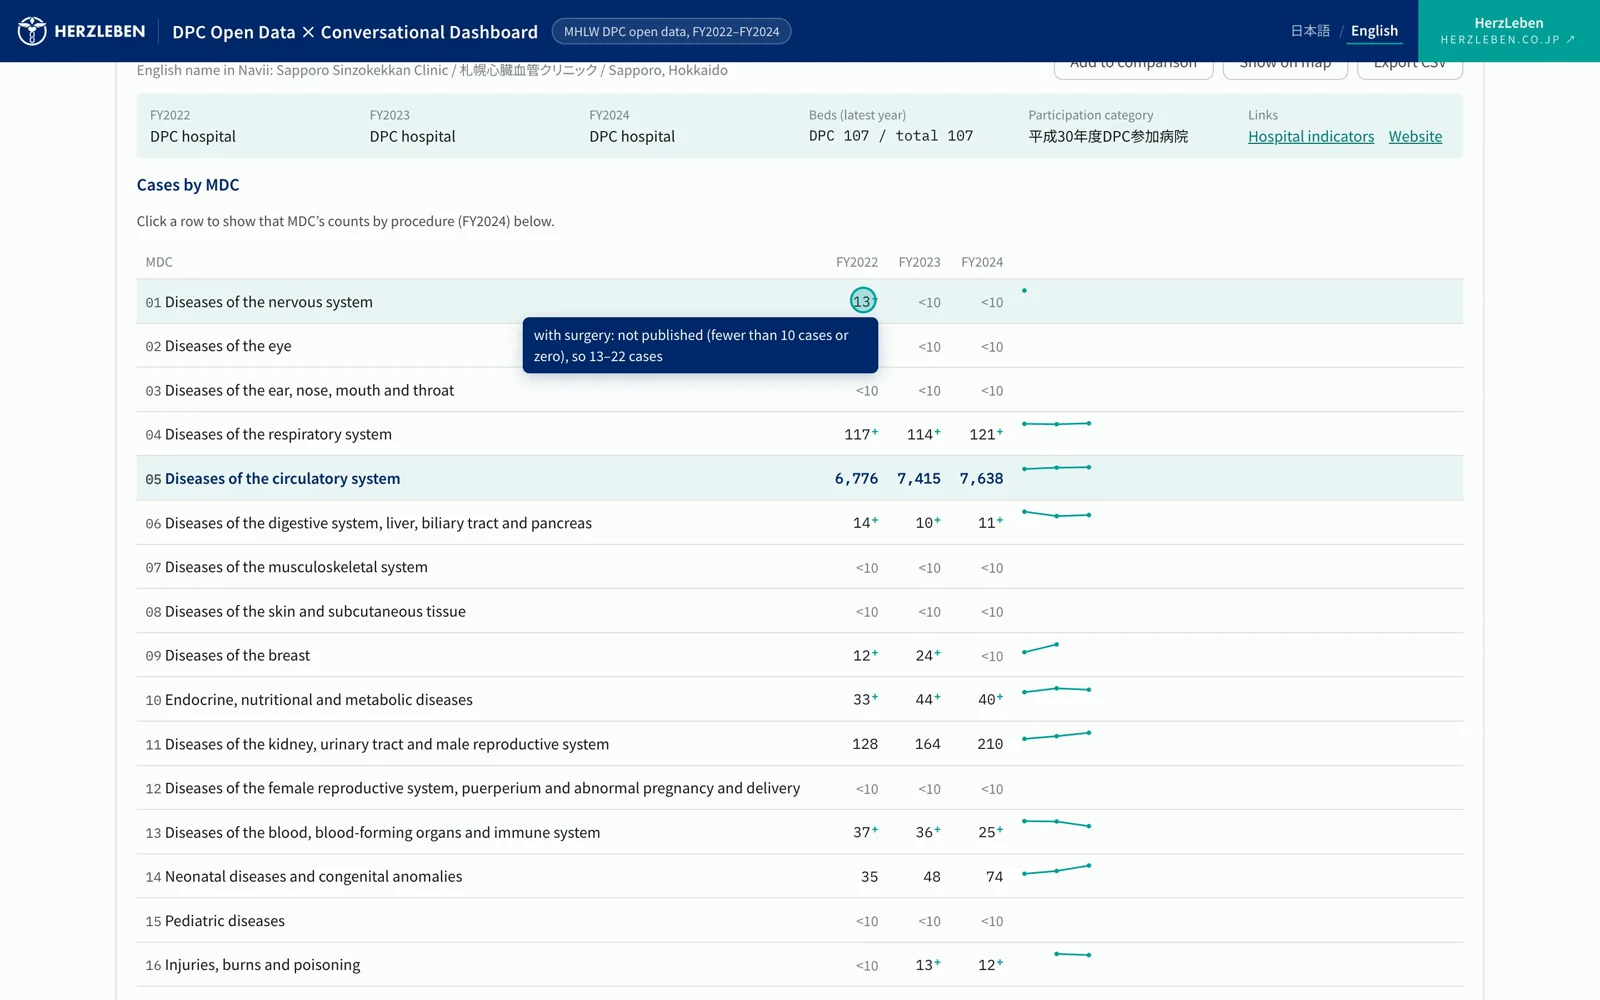
Hovering over the "+" shows that the with-surgery count is undisclosed, and the possible range
The upper bound can be calculated from published information alone, and it tells you whether the ranges of the first and second places overlap. It is there to keep readers from reading too much into the rankings.
8. Finding the errors that survive passing tests
In every error so far, the code ran, the tests passed and the counts matched. We found them from these four angles.
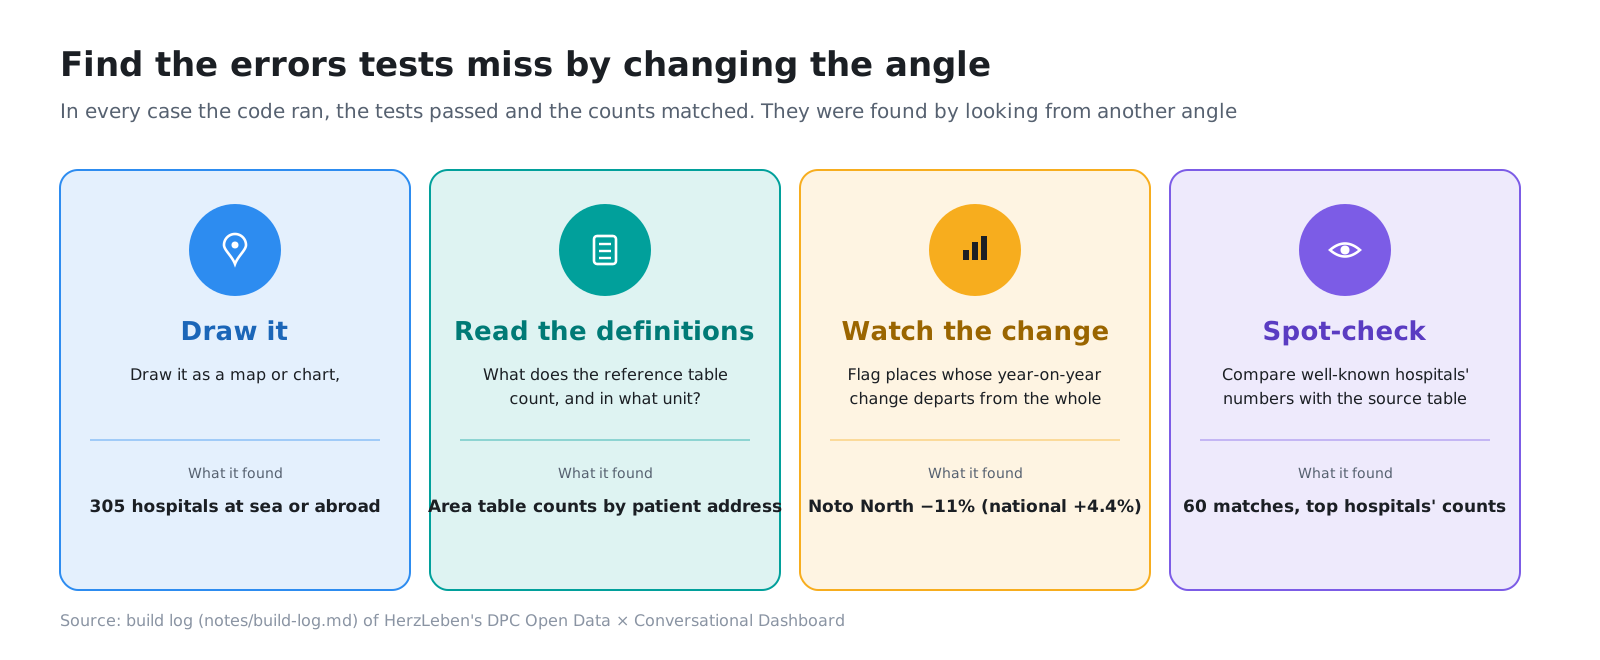
When you have generative AI build tables or lists, the result can look right but be wrong. Just as its sentences sound plausible, its numbers line up plausibly. That is exactly why, the more you have the AI build, the more you need a person to check from a different angle at each break in the work.
9. This post’s harness
| Tool | In this project | Role |
|---|---|---|
| Reconciliation that stops | pipeline/validate.py, run.sh |
Does not write the app data if a check fails |
| Reconciliation report | data/out/validation.md |
Writes out stopping checks and report-only checks on every run |
| How checks are added | Confirm the check catches the error in the pre-fix data, then fix | Prevents checks that catch nothing |
| Fix-only commits | The zero-coordinates fix as its own commit | Lets you see later what changed |
| Review of the real screen | Claude in Chrome, checks with a set device width | Finds errors the tables do not show |
| Human judgment | What a report means, rules for presenting numbers | Where a machine cannot decide right or wrong |
10. Summary
- Most errors during the build were still there after the tests and the count reconciliation had passed
- Reconciliation is something you grow. When you find an error, add a check after confirming it catches the error in the pre-fix data. Sometimes one check is not enough
- Draw it, read the definition, look at the changes, spot-check. Changing the angle brings out errors the tables do not show
- Even correct numbers can mislead depending on how they are shown. We never add undisclosed values as zero, and made a clutter-free way of writing the rule
The correctness of the numbers is ensured by reconciliation and human eyes, not by the AI.
Next step
Part 3 finally covers adding generative AI: a design that never hands the AI a single count, the four checkpoints a response passes before it reaches the screen, how we split tests that call the real API from tests that do not, and the case where we stopped the AI’s variation with rules on the server rather than with the instructions.
Sources
- MHLW, Results of the FY2024 Survey for the Evaluation and Verification of DPC: Discharge Survey (published March 30, 2026; data replaced June 30, 2026). https://www.mhlw.go.jp/stf/shingi2/newpage_00203.html
- MHLW, Results of the FY2023 Survey on the Impact of DPC Introduction: Discharge Survey. https://www.mhlw.go.jp/stf/shingi2/newpage_00137.html
- MHLW, Results of the FY2022 Survey on the Impact of DPC Introduction: Discharge Survey. https://www.mhlw.go.jp/stf/shingi2/newpage_39119.html
- MHLW, Iryo Joho Net open data (as of June 1, 2026). https://www.mhlw.go.jp/stf/seisakunitsuite/bunya/kenkou_iryou/iryou/newpage_43373.html
- Map: Geospatial Information Authority of Japan, GSI Tiles (pale map)
- The figures and tables in this post were prepared by HerzLeben Inc. from the sources above; they were not produced by the Japanese government