
Claude Code × Medical Application
[Data Explainer] Japan's DPC Open Data — How the Discharge Survey Is Structured and How to Read It
1. About this page
This is a reference page that explains the DPC open data used in the series “From In-House BI to an AI Dashboard,” kept separate from the main articles. It aims to answer, on one page, questions such as “What is DPC?”, “Which Excel file holds what?” and “Can I just add these numbers up?”
- 6,372hospitalstook part in the FY2024 discharge survey, about 80% of all hospitals in Japan
- 11.76Mdischargesthe scale of FY2024 (June 2024 to May 2025)
- 3,248codesDPC codes in the FY2024 revision (previously 4,726)
- 73.6%share of cells in the cases-by-MDC table that are suppressed (“-”)
Every number on this page was checked against files downloaded from the FY2022–FY2024 results pages on October 23, 2026. Screenshots were taken the same day.
Japanese fiscal years run from April to March and are named by the starting year (FY2024 = Reiwa 6). As section 6-1 explains, the survey’s own “year” does not always follow that rule.
2. DPC/PDPS — how inpatient care is paid for
2-1. A fixed amount per day
DPC/PDPS (Diagnosis Procedure Combination / Per-Diem Payment System) is Japan’s payment system for acute inpatient care. It started in 2003 at 82 advanced treatment hospitals, mostly university hospitals, and today 1,767 hospitals (FY2024) are paid this way.
Under fee-for-service, every test, drug and procedure is added up one by one. Under DPC, a per-day rate is set for each combination of diagnosis and the surgery or procedures performed (the DPC code). Multiply it by the number of days and by a hospital-specific coefficient, and you get the bundled part. Some items, such as surgery and anesthesia, are still added on a fee-for-service basis.
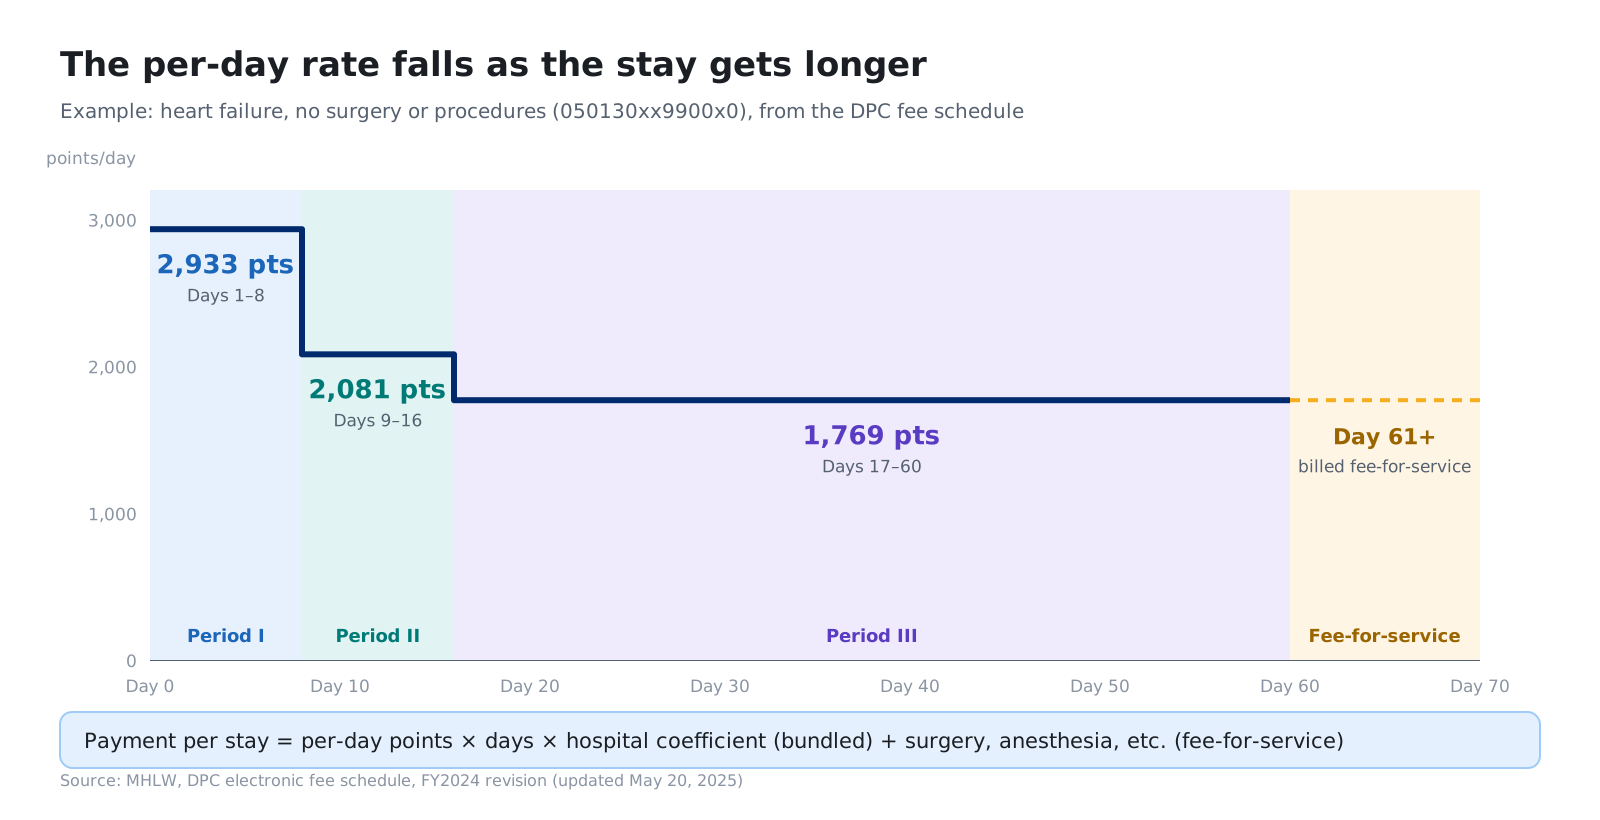
The per-day rate steps down through three periods. In the heart failure example above, it is 2,933 points up to day 8, 2,081 up to day 16 and 1,769 up to day 60; from day 61 the stay is billed fee-for-service again. Longer stays earn the hospital less per day, which pushes toward shorter stays. That is why the discharge survey publishes detailed length-of-stay figures every year: to watch the effect of this design.
2-2. The 14-digit DPC code
The unit of payment, the DPC code, is a 14-digit number. Reading from the left, it narrows down: which organ system (MDC), which diagnosis, which surgery, whether there were procedures, and so on.
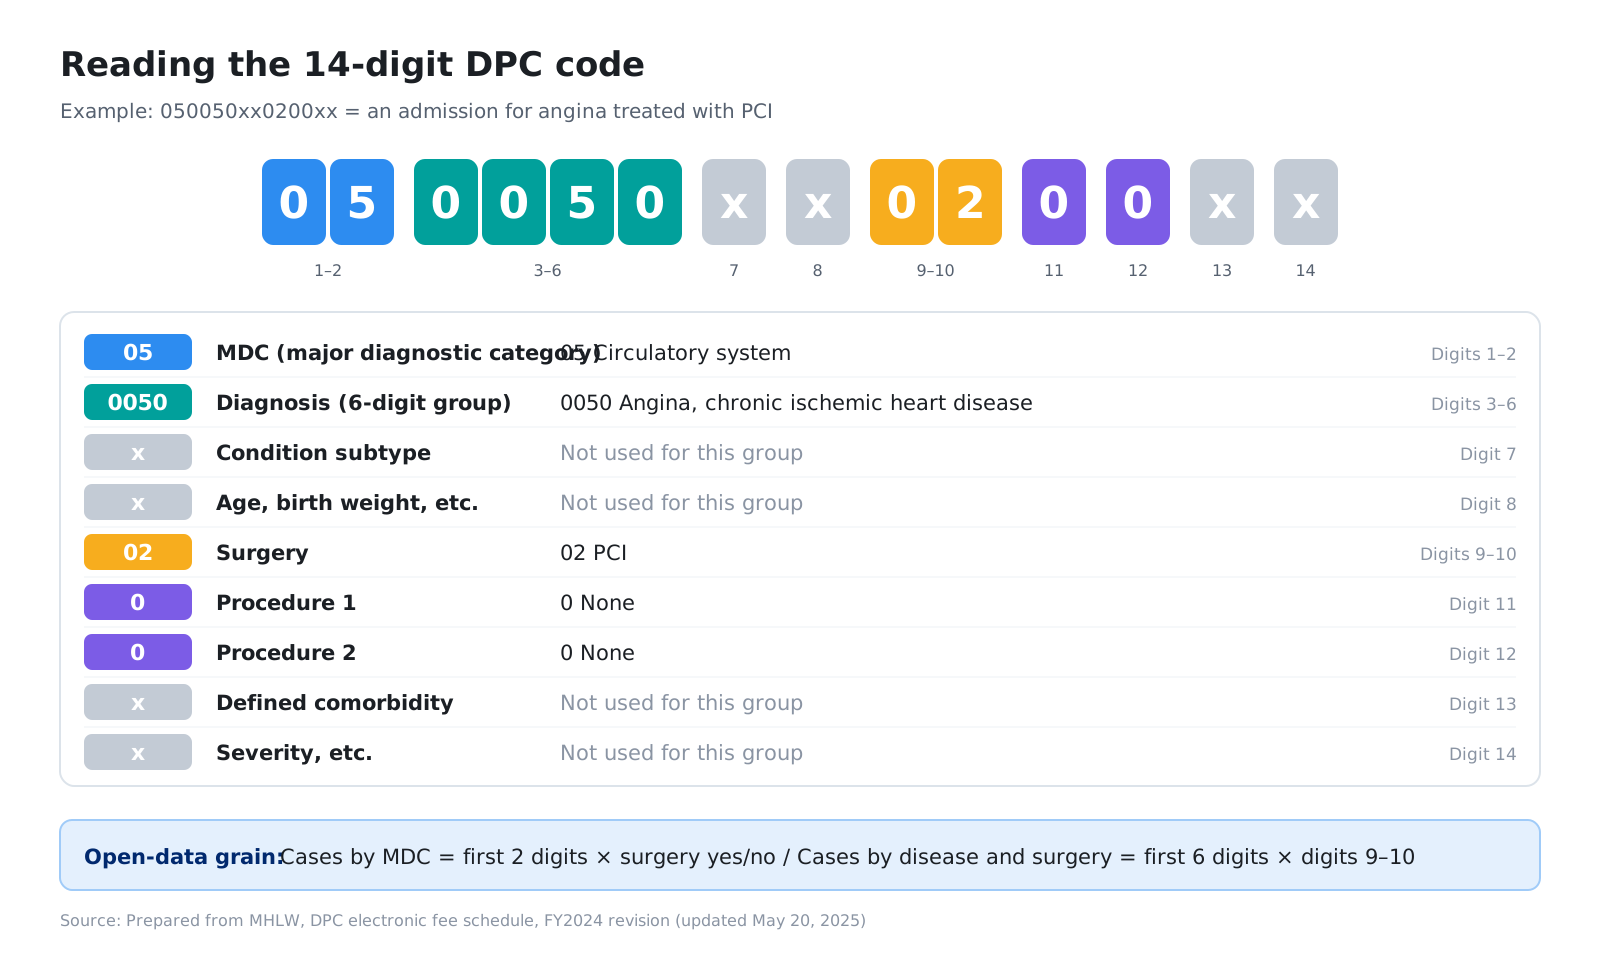
- The first 2 digits (MDC) are the major diagnostic category, with 18 categories from 01 Nervous system to 18 Other
- The first 6 digits are the diagnosis group; there are 506 in the FY2024 revision
- Digits 9–10 are surgery: 99 = no surgery, 97 = other surgery not defined for the group, 01, 02 … = surgeries defined for that diagnosis
The code set is revised with each fee revision. In the FY2024 revision (effective June 2024), the total number of codes fell from 4,726 to 3,248, and the number of codes paid on a bundled basis fell from 4,064 to 2,477. Before comparing “cases for the same code” across years, check that the code still means the same thing.
3. What the discharge survey is
3-1. Who submits what
To evaluate DPC, participating hospitals submit data on every discharged patient to the government (for example “Form 1,” a short clinical summary, and the “EF file,” an itemized record of services). The DPC Evaluation Subcommittee of the Central Social Insurance Medical Council (Chuikyo) tabulates this data, and the published annual results are the discharge survey.
Not only DPC-paid hospitals submit data. Hospitals preparing to join DPC (DPC-preparing hospitals) and hospitals that are paid fee-for-service but submit data in the same format (fee-for-service hospitals) are included too. In FY2024 they total 6,372, about 80% of Japan’s 8,022 hospitals (end of May 2025).
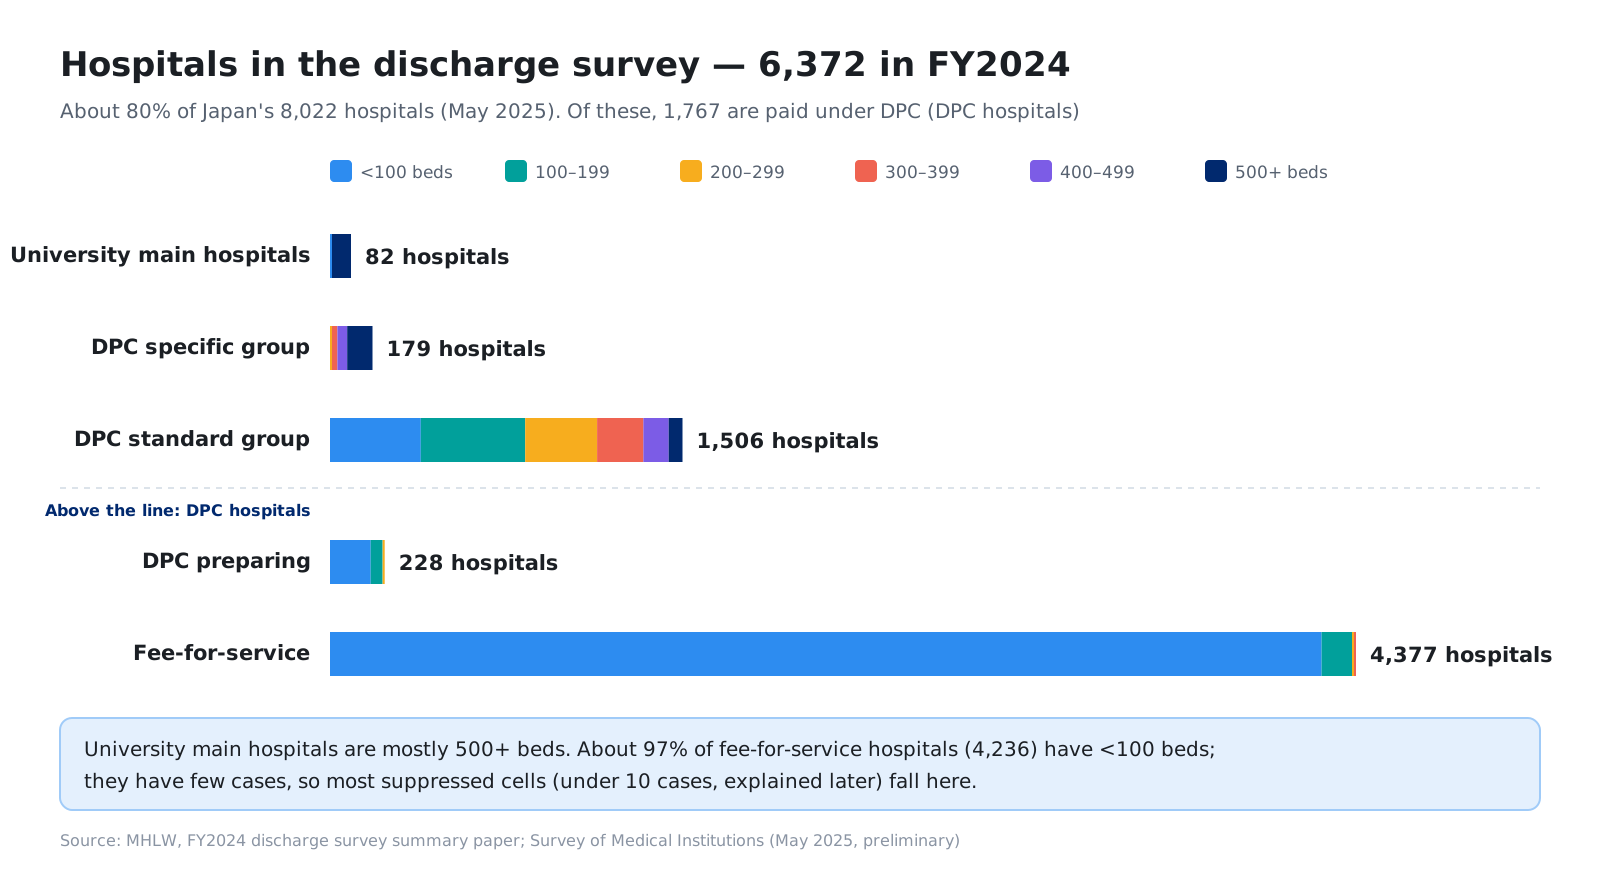
The mix is lopsided. Almost all 82 university main hospitals have 500 beds or more, while about 97% of the 4,377 fee-for-service hospitals have fewer than 100. By count, hospitals under 100 beds make up three quarters (4,799), but by patients, the DPC standard group accounts for more than half (54%). This imbalance shapes where the suppressed cells described later appear.
3-2. How many patients
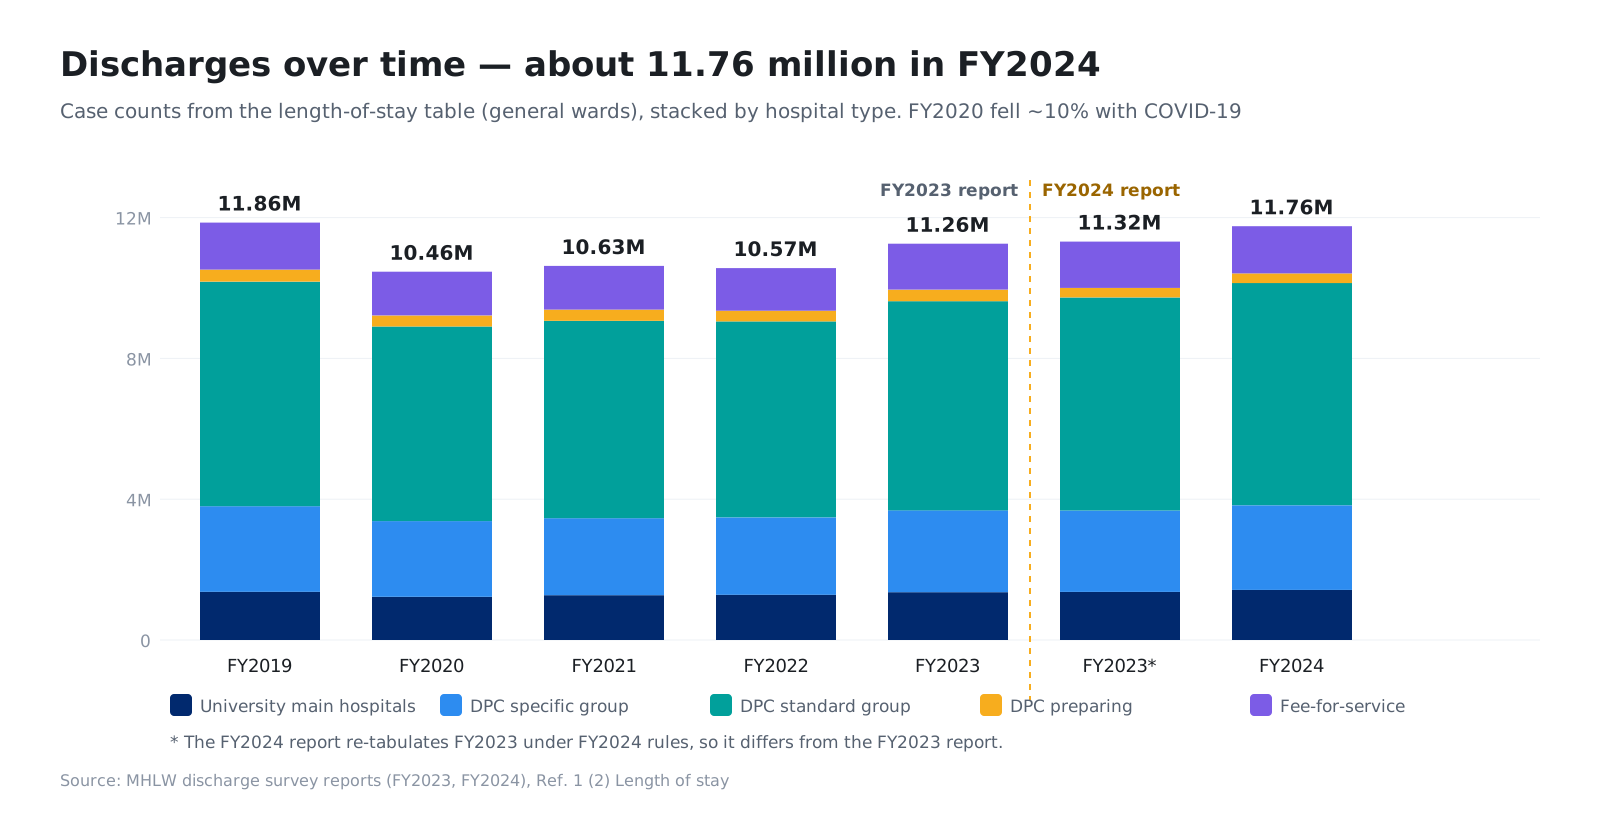
Discharges exceed 10 million a year. FY2020 dropped about 12% from the year before because of COVID-19, then recovered gradually, and FY2024 is close to the FY2019 level. FY2023 appears twice in the chart because the FY2024 report re-tabulates FY2023 under FY2024 rules (see 6-6).
4. The published tables
4-1. The results page
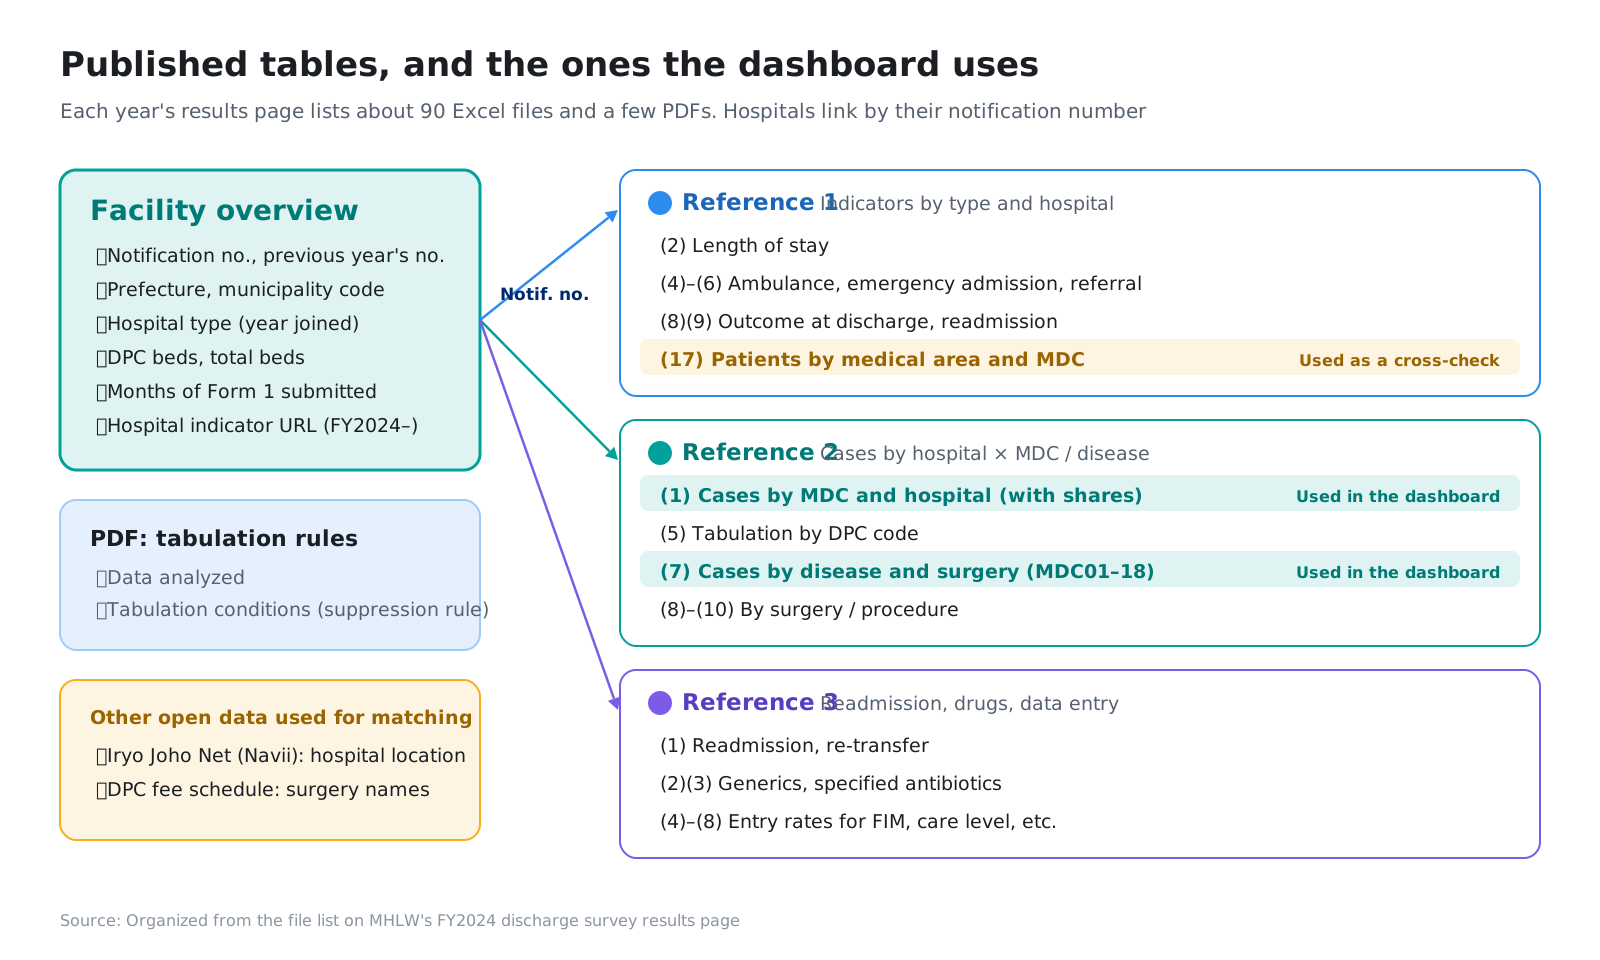
Each year’s results are on a single page that lists about 90 Excel files and a few PDFs on tabulation rules. No login or application is needed; anyone can download them.
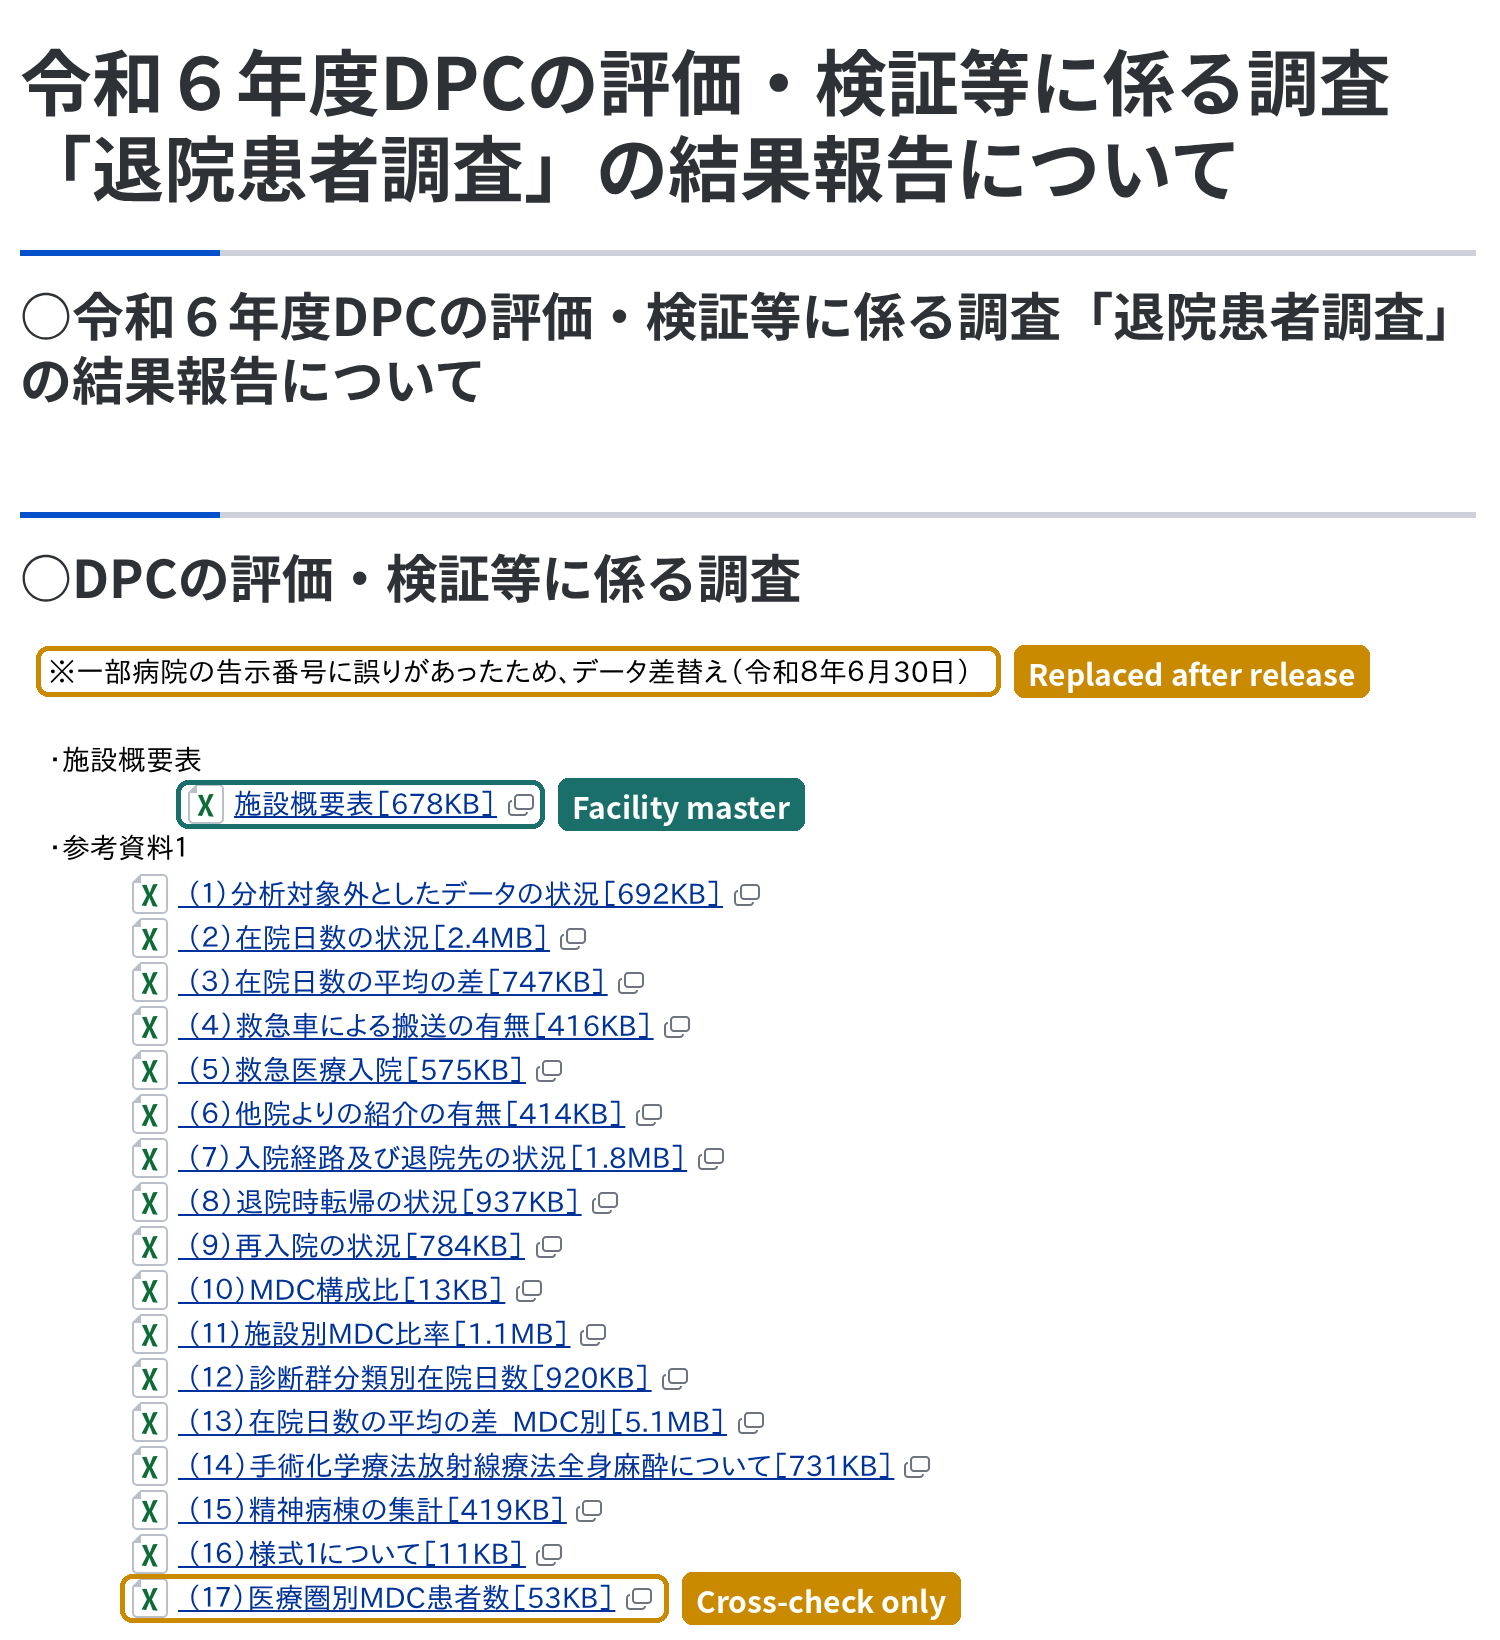
The files are grouped into the facility overview, References 1 to 3, and other reference material. Each has one row per hospital and links back to the facility overview through the notification number (kokuji bango).
4-2. What the raw Excel files look like
This is what you see when you open the files. Swipe or click through to compare them.
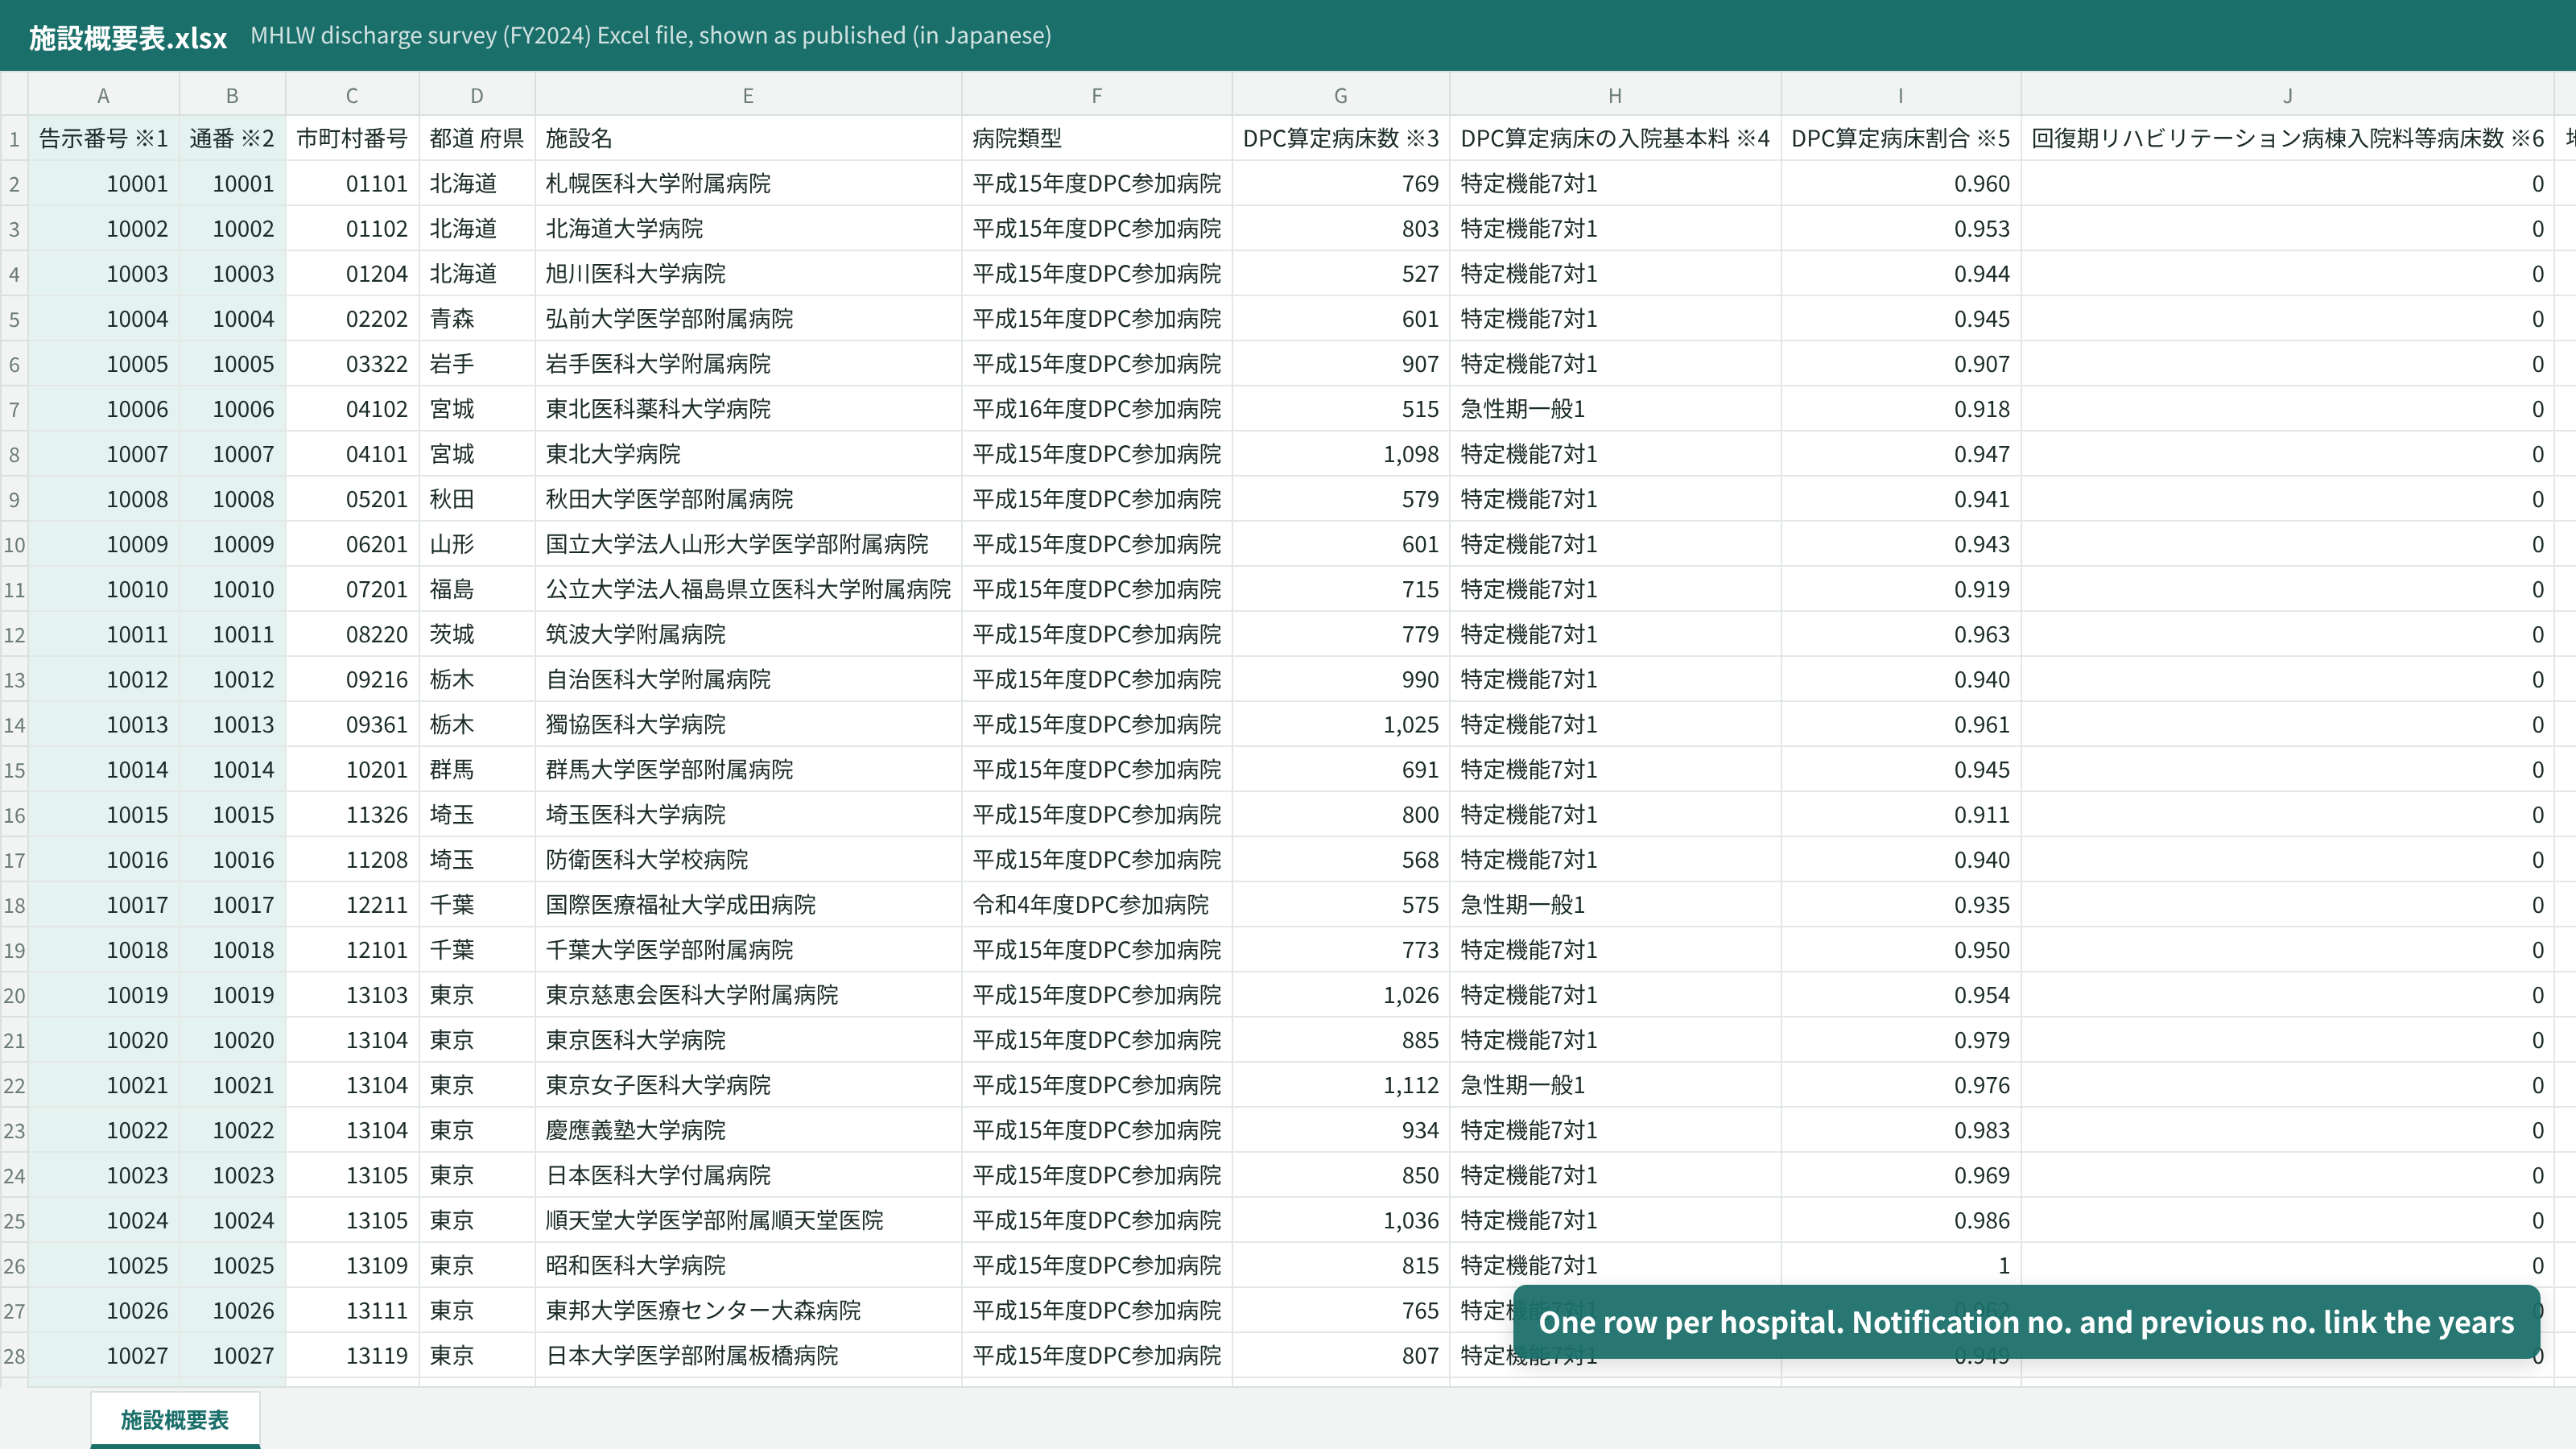
Facility overview. One row per hospital, with notification number, previous number, municipality code and bed counts 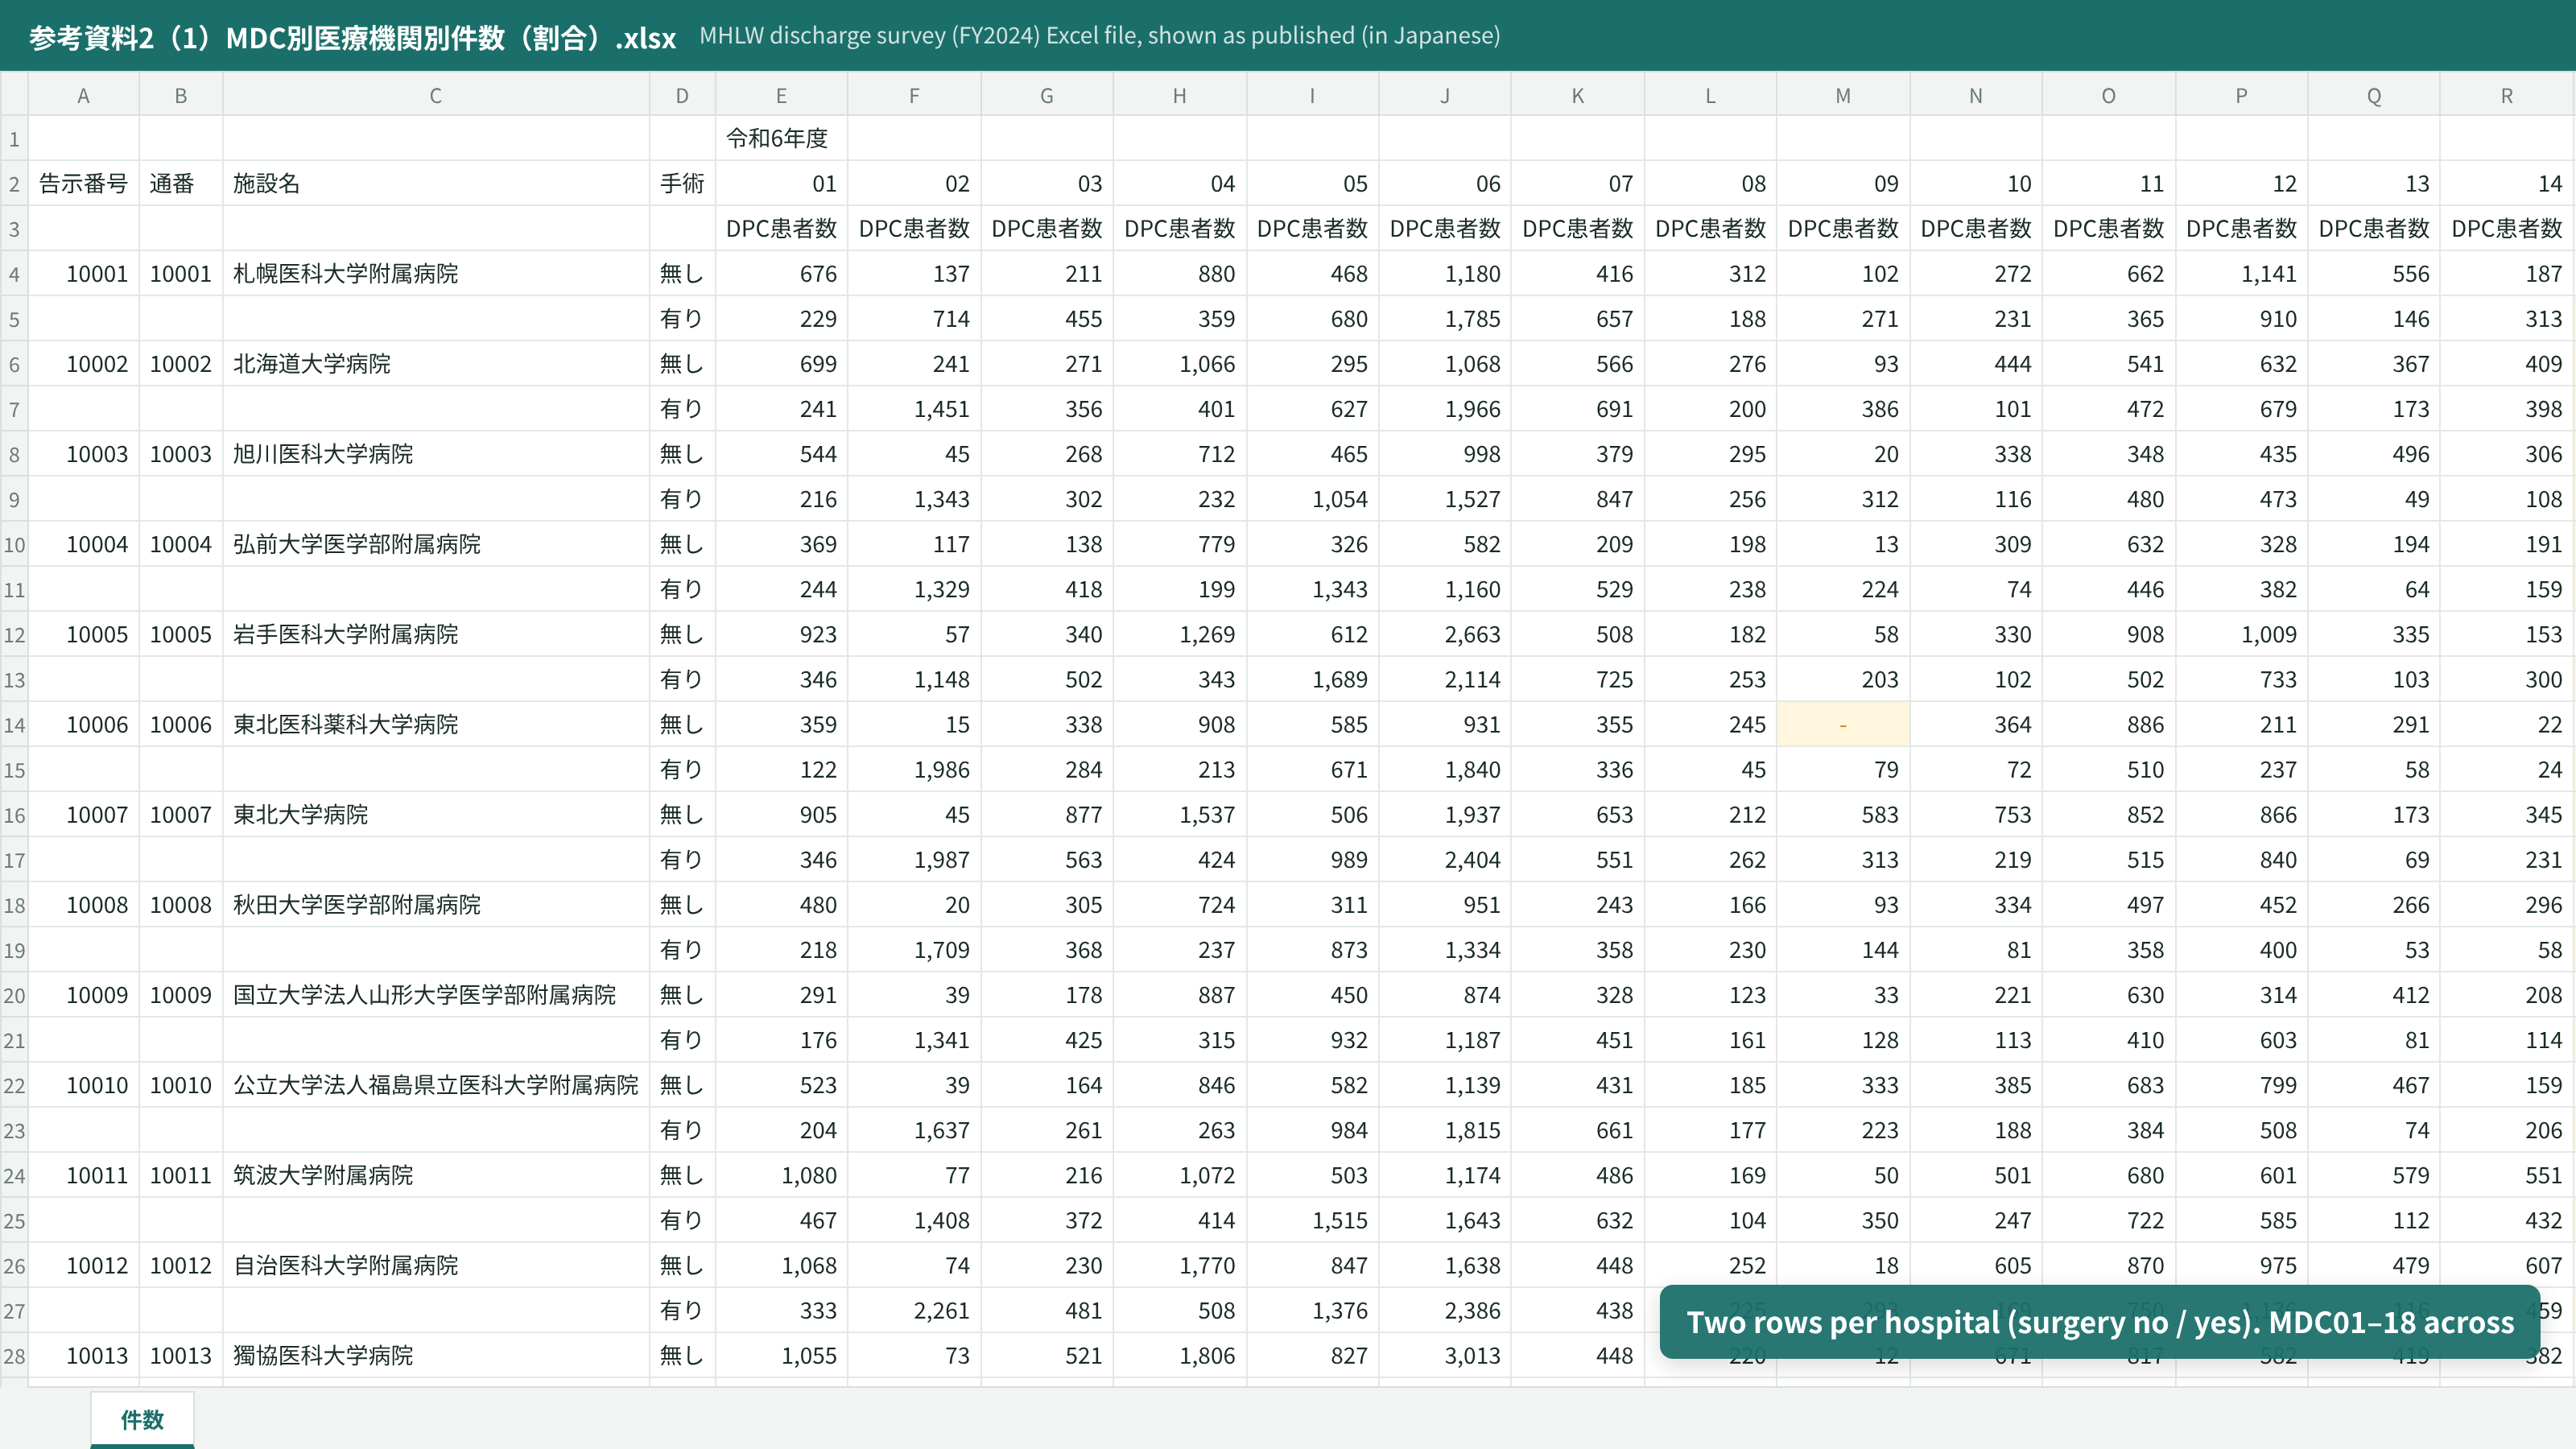
Cases by MDC and hospital. Two rows per hospital (surgery no / yes), with MDC01–18 across 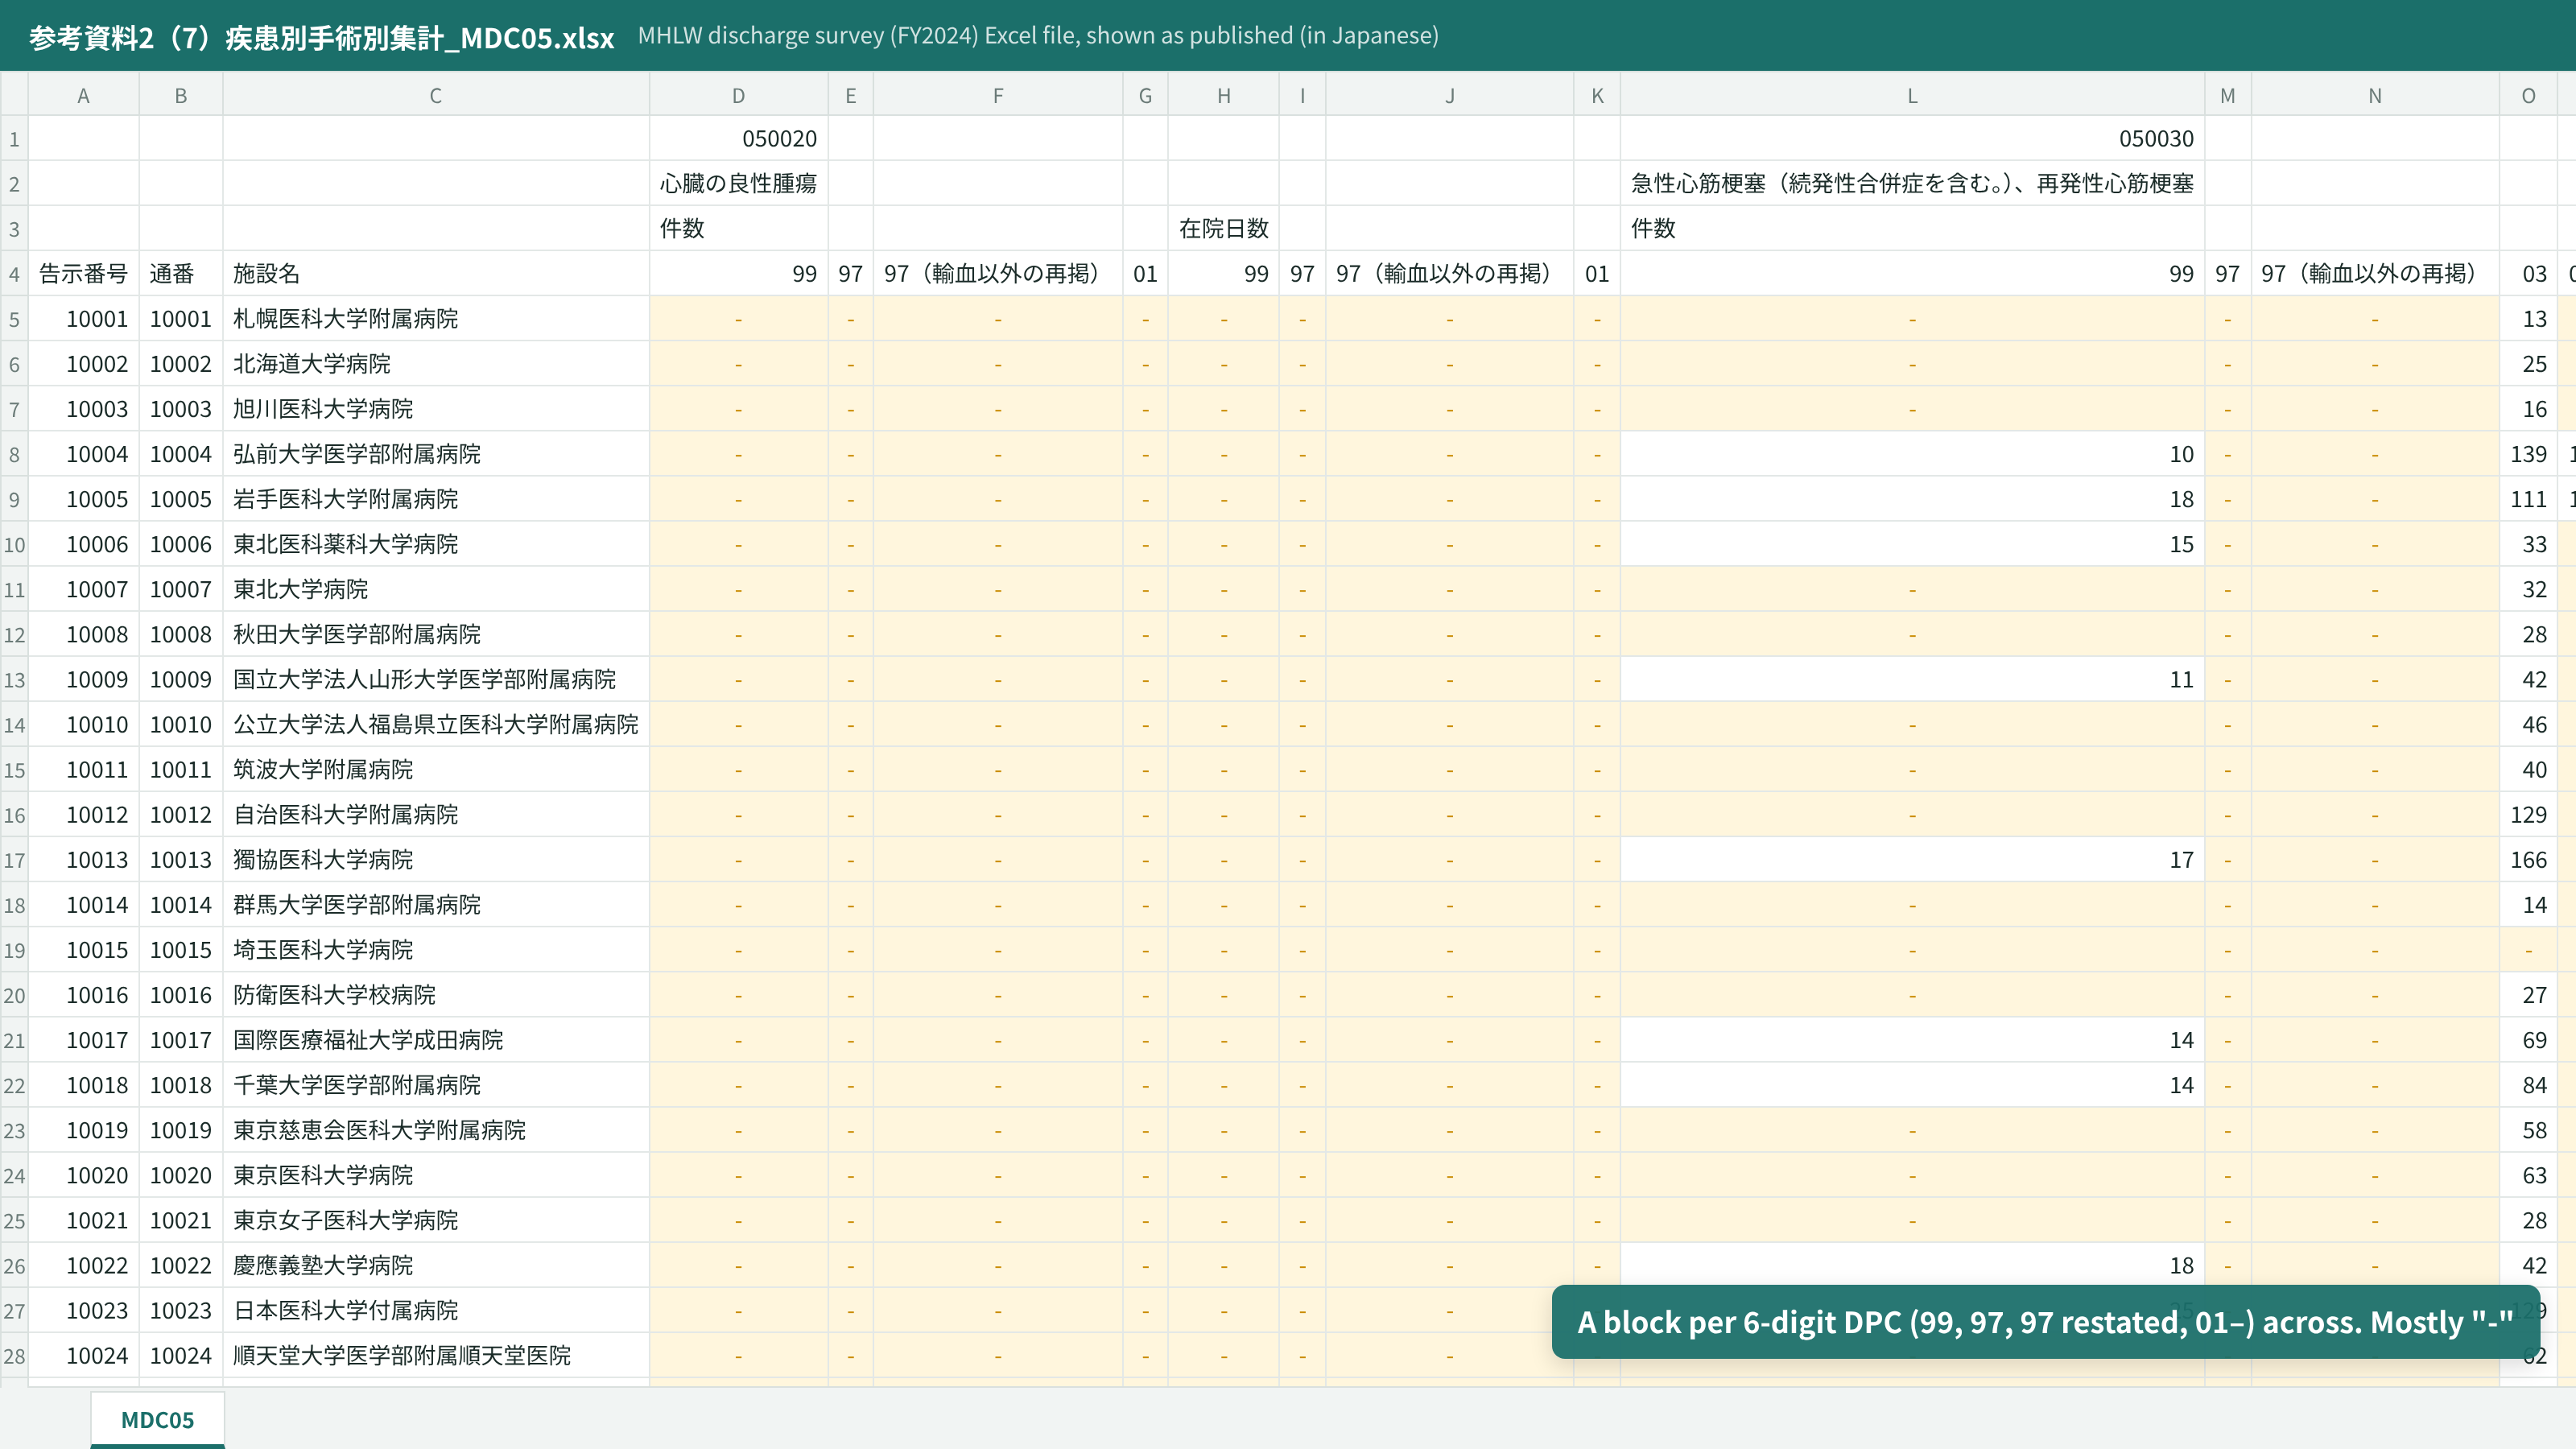
Cases by disease and surgery (MDC05). A block per 6-digit disease runs across, and most cells are "-" 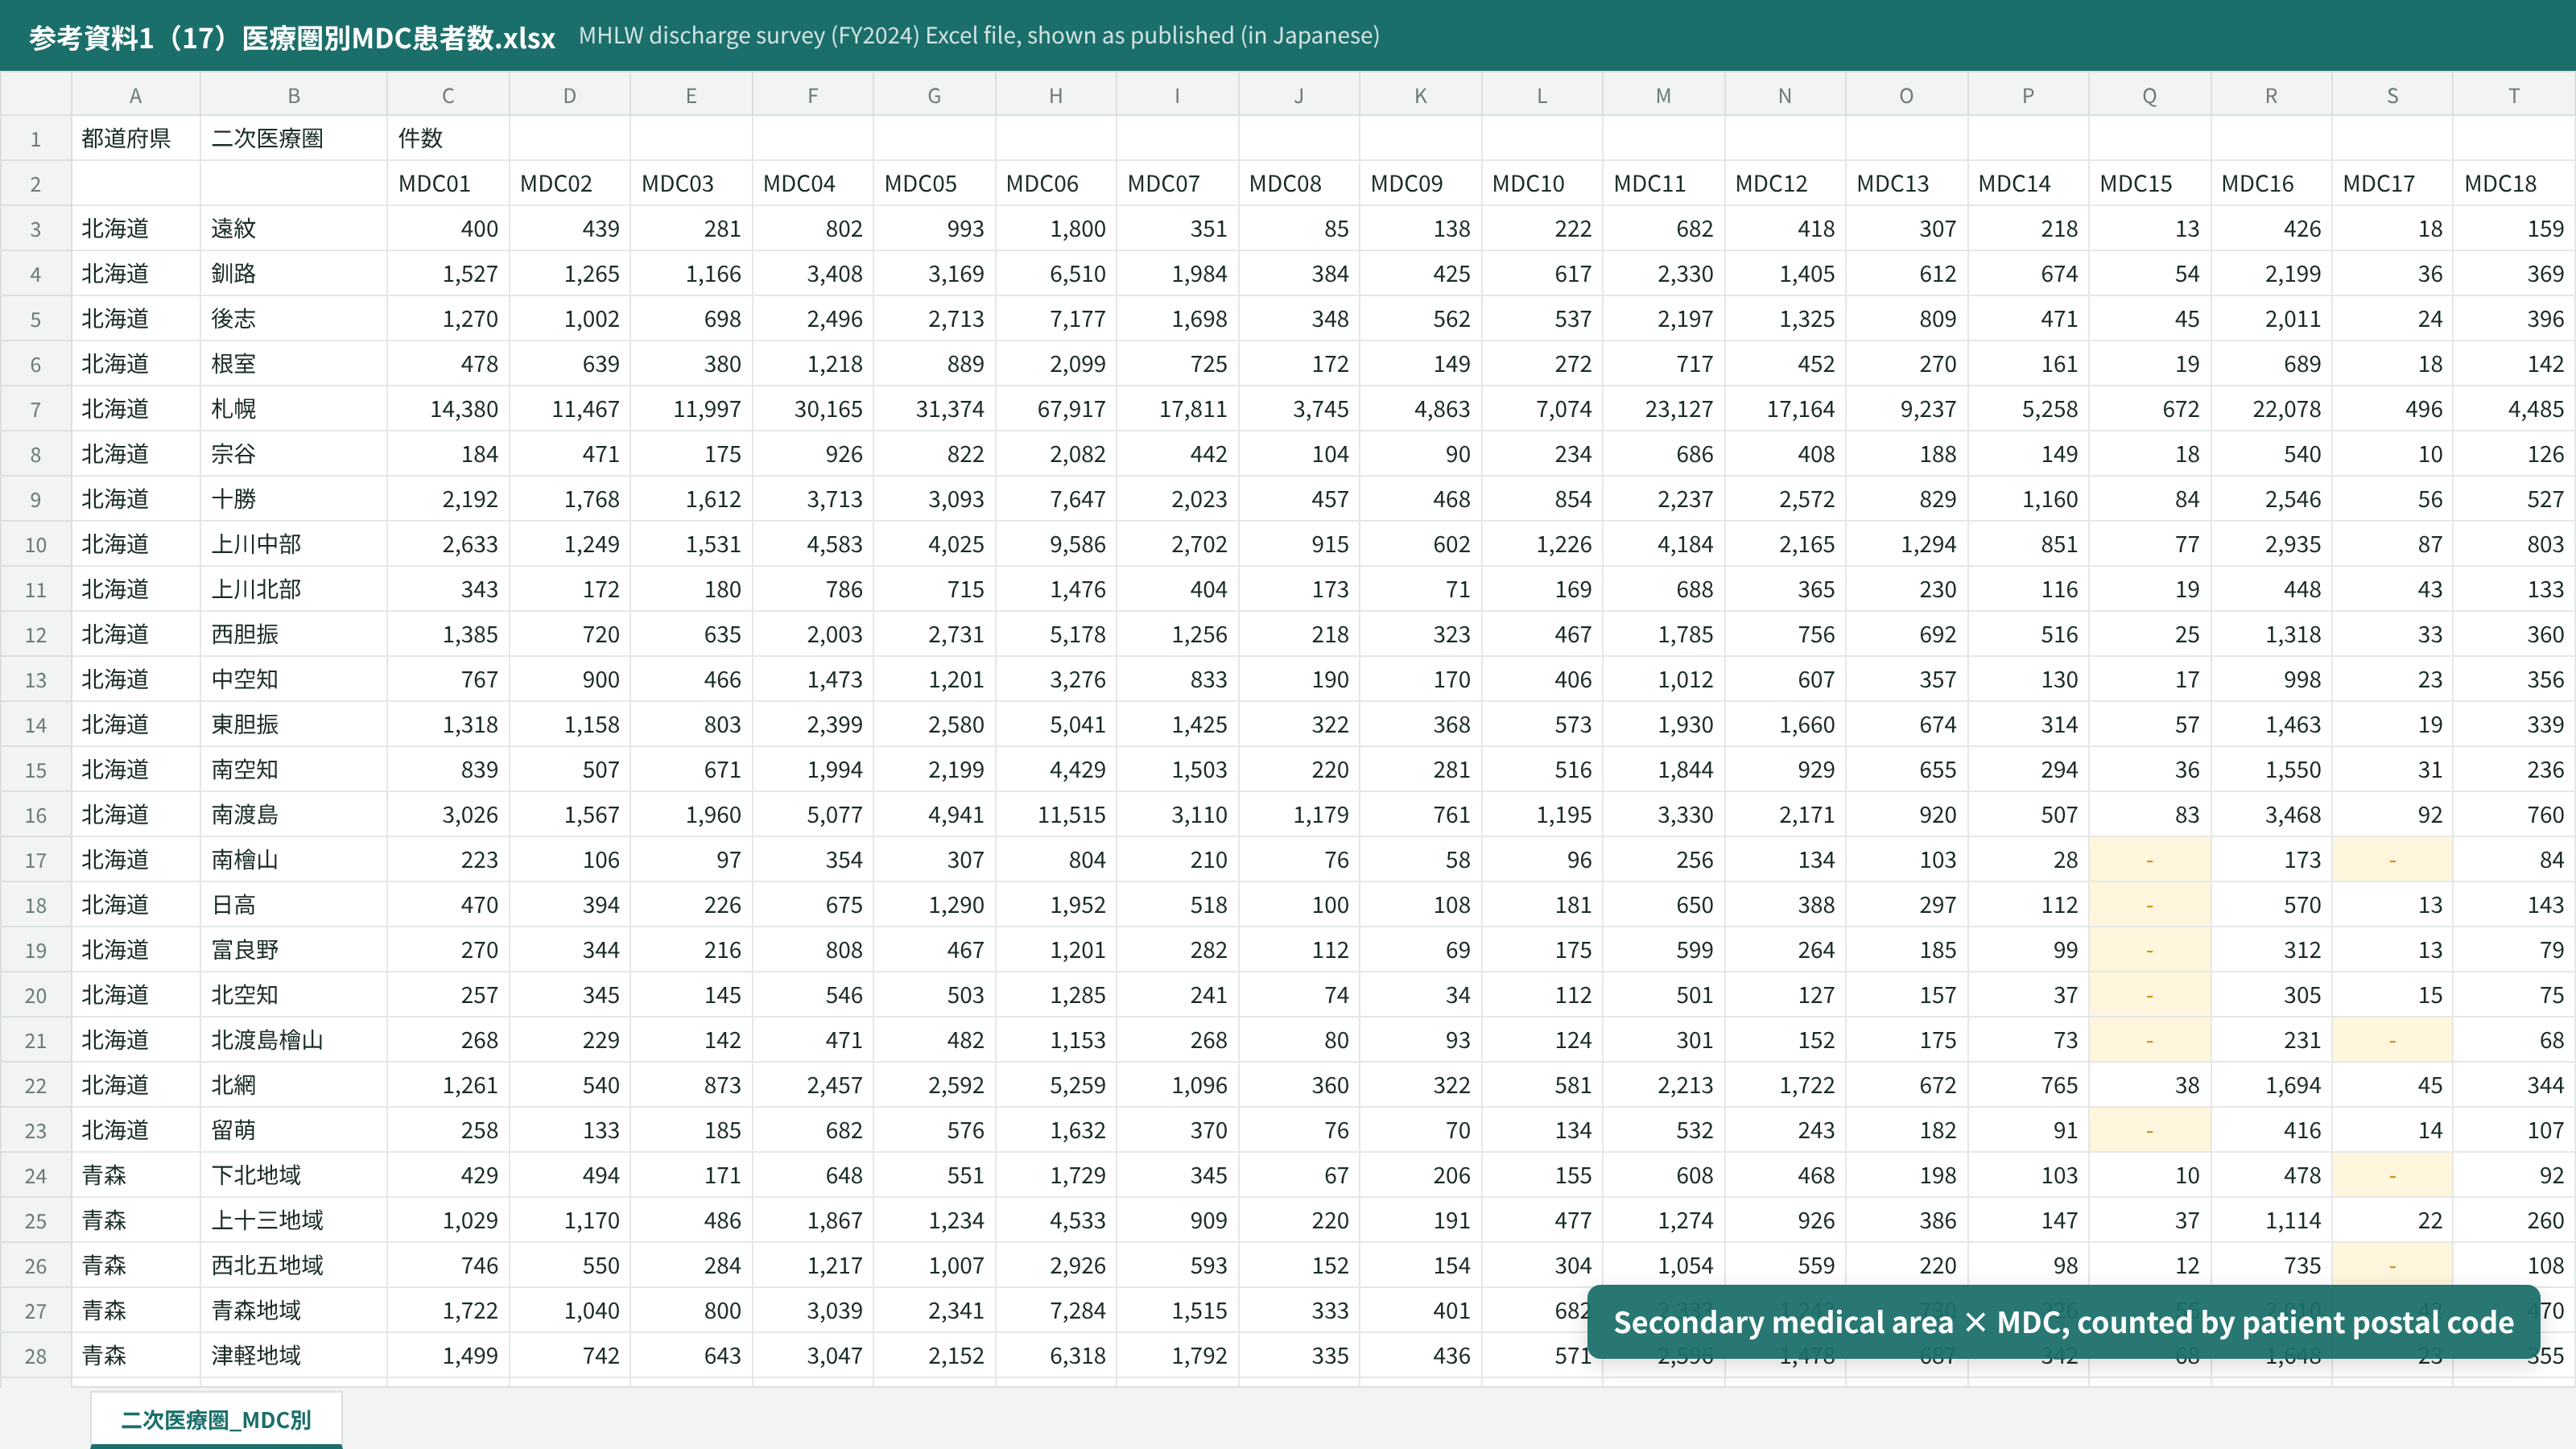
Patients by medical area and MDC. Secondary medical area × MDC, counted by patient address
Every table is designed for people to read: headers span several rows, cells are merged, and notes continue below the table. Reading them by machine means unpicking that layout first (covered in the main article under “Preparing the data”).
5. The three tables the dashboard uses
5-1. Facility overview — the hospital master
One row per hospital, with the notification number, the previous number (last year’s notification number), municipality code, prefecture, name, hospital type, DPC beds and total beds. From FY2024 it also carries the URL of each hospital’s published quality indicators (1,758 DPC hospitals).
The columns shift slightly from year to year. FY2024 added beds for the community-based acute care ward, and the months of Form 1 submitted now count from June 2024 to May 2025. When using the same column across years, match by header name.
5-2. Cases by MDC and hospital — hospital × MDC × surgery
Each hospital has two rows, surgery “no” and “yes,” with case counts for MDC01–18 across. The same file has two sheets: counts and shares.
“Surgery yes” means Form 1 records a surgery. However, cases whose only procedures are transfusion-related (K920 transfusion, K920-2 transfusion management fee, K923 intra/postoperative autologous blood recovery) are counted as “no.” The table is published in the same form for all three years, so the dashboard’s three-year trend is built from it.
5-3. Cases by disease and surgery — hospital × disease (6-digit) × surgery
For each disease (first 6 digits of the DPC code), this table lists case counts and mean length of stay by surgery branch (digits 9–10), per hospital. There is one file per MDC, and for FY2024 the MDC17 (mental disorders) file was not published.
One branch column is “97 (restated, excluding transfusion).” It is a restated subset of 97 (other surgery) with transfusion-related procedures removed, so adding it to 97 double-counts.
This table includes only diseases whose codes split by surgery. Diseases with no defined surgery branches have no rows at all.
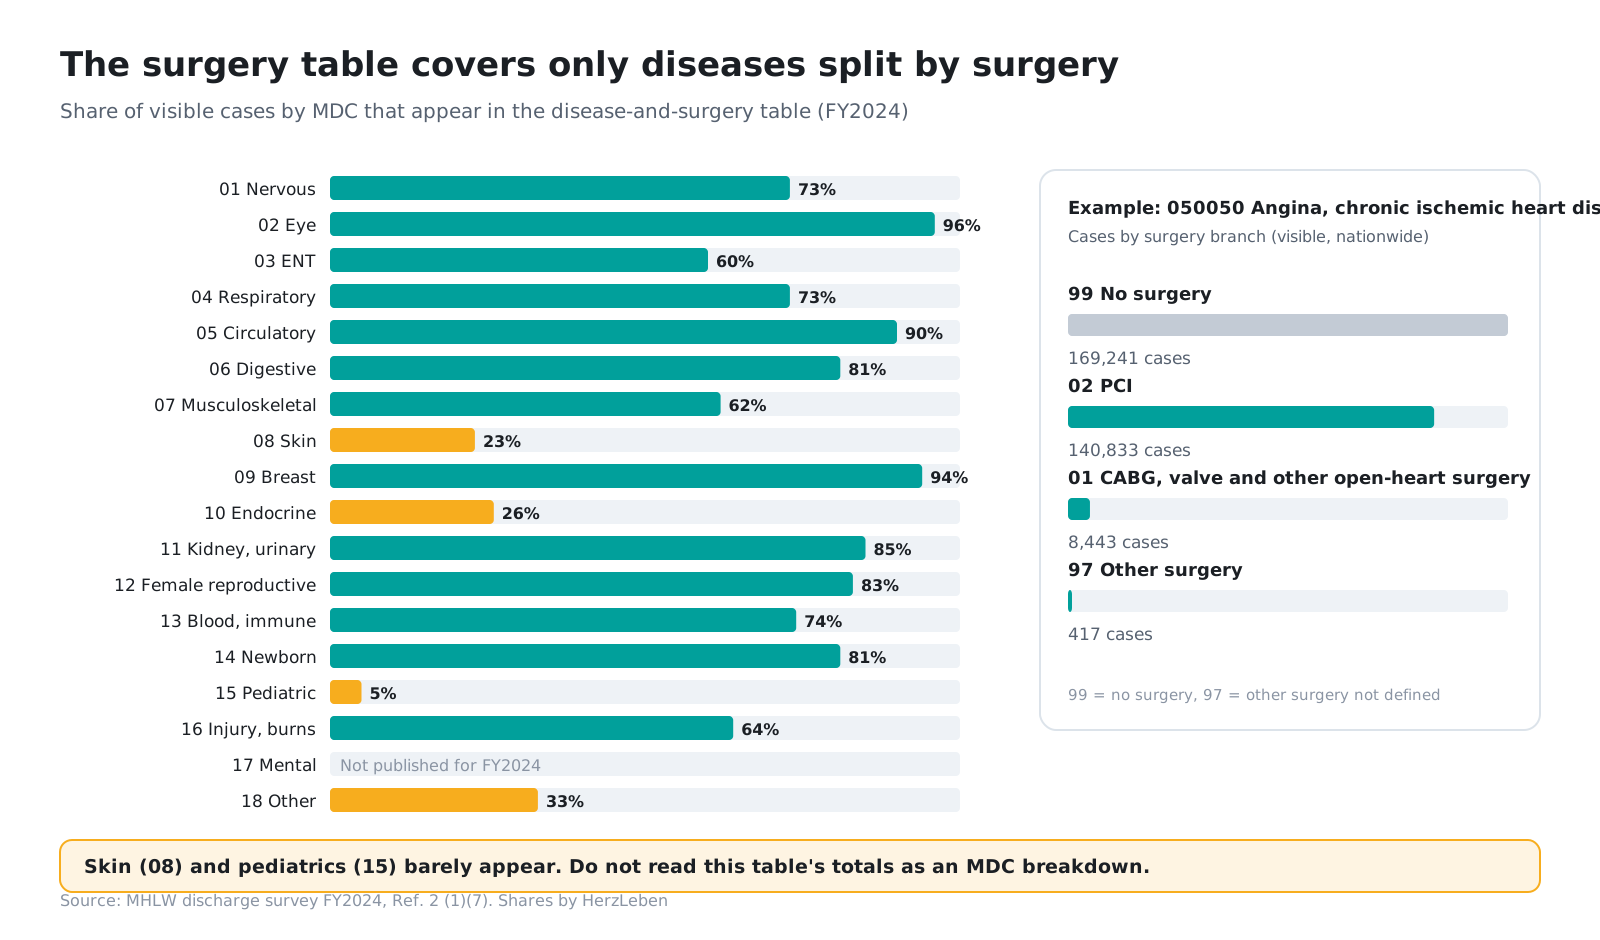
More than 90% of circulatory (05) and eye (02) cases appear in this table, but only 23% of skin (08) and 5% of pediatric (15) cases. Reading this table’s totals as “the breakdown of that MDC” leads to large errors. The dashboard labels it “diseases with defined surgery branches only” and keeps it out of the MDC breakdown charts. Surgery names come from the DPC electronic fee schedule (FY2024 revision, updated May 20, 2025).
6. Reading pitfalls
6-1. The survey year is set by discharge date
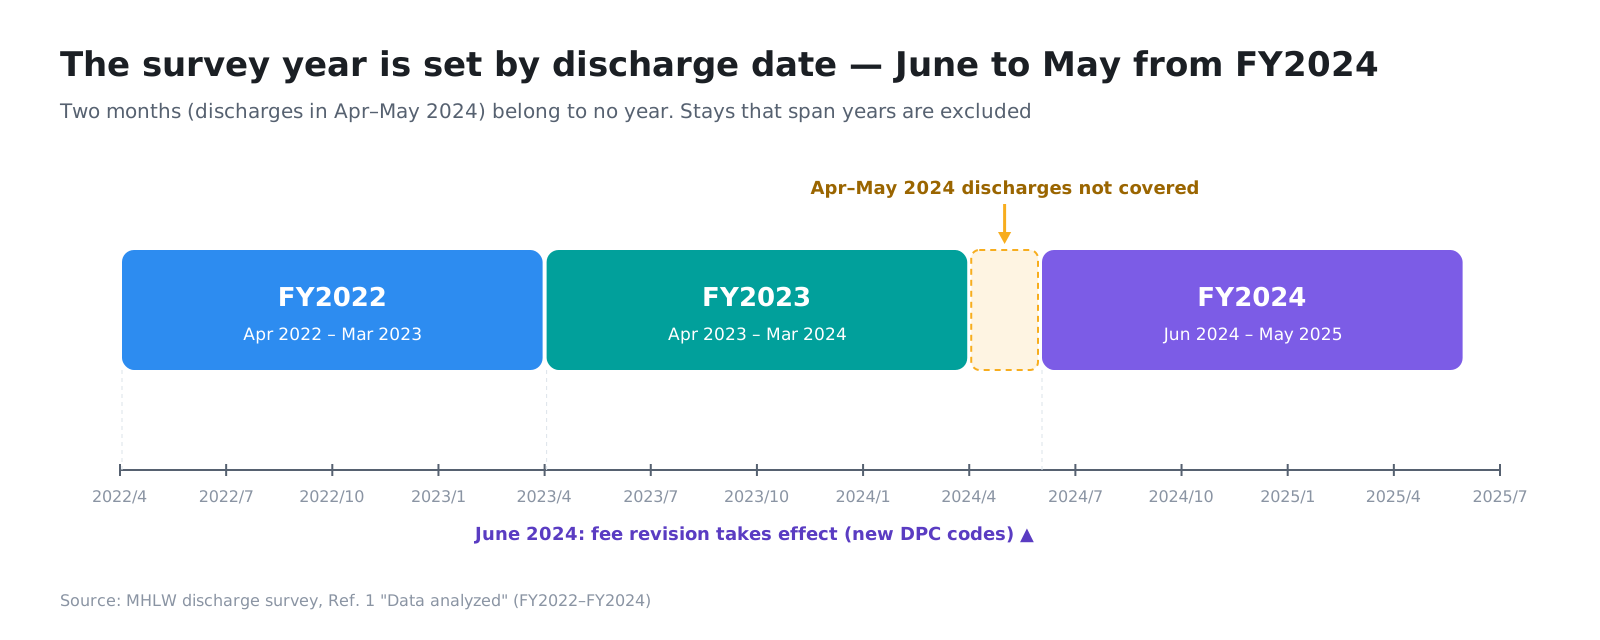
Each survey “year” covers patients discharged during that period. Through FY2023 that was April to the following March, but FY2024 covers June 2024 to May 2025, aligned with the fee revision that took effect in June 2024. As a result, patients discharged in April or May 2024 are in no year at all.
Also, the survey counts only patients who were both admitted and discharged within the period. Patients still in hospital from the previous year are excluded, so hospitals with many long stays look smaller than they are. Other cases are excluded too, such as stays of one day or less, deaths within 24 hours, transplant surgery and self-pay only (Reference 1, “Data analyzed”).
6-2. A dash “-” means “under 10 cases, or zero”
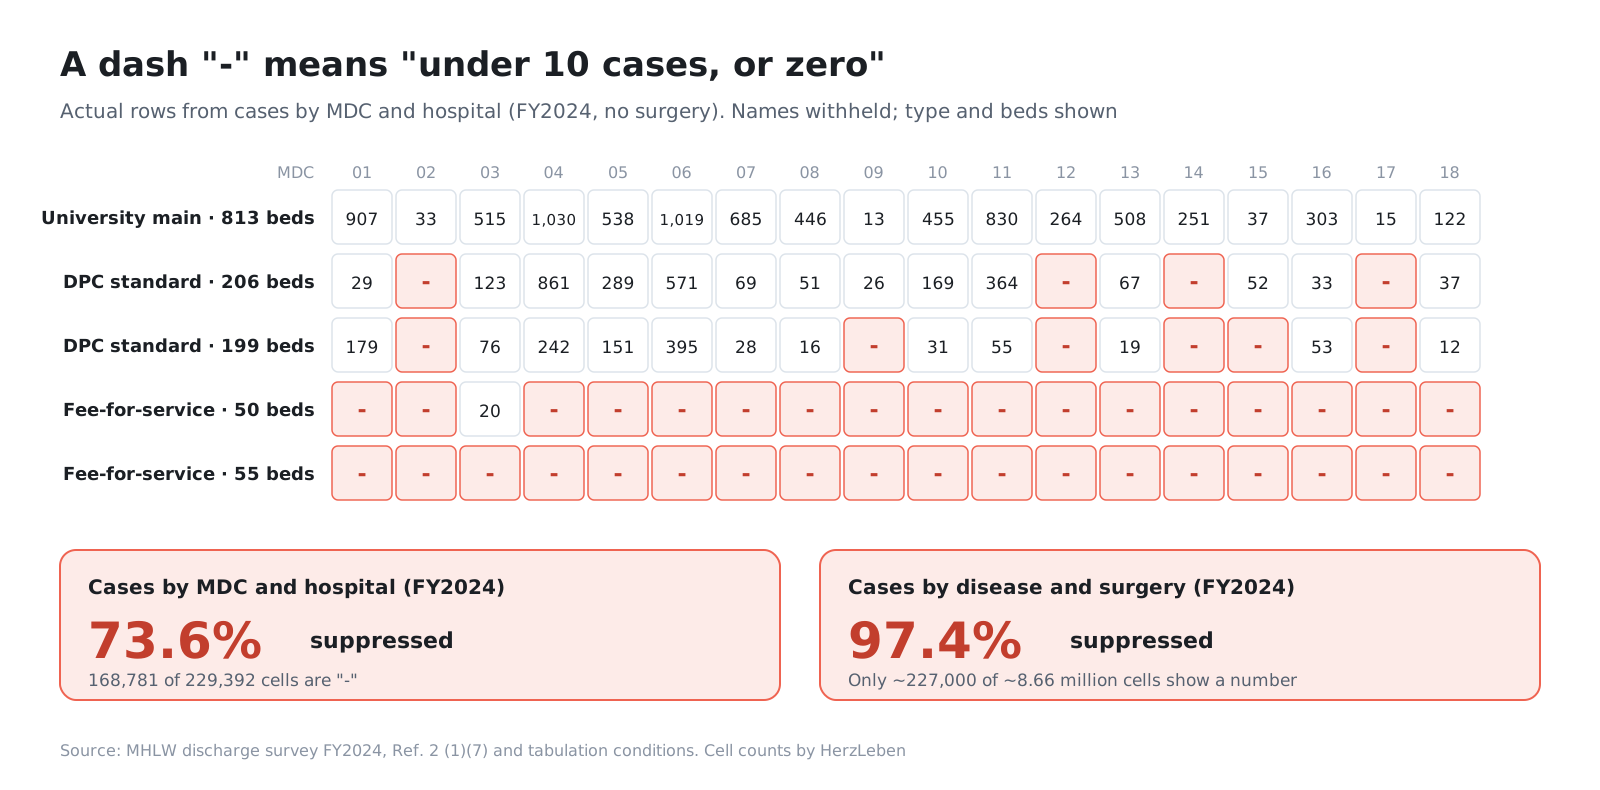
To keep patients from being identified, any value under 10 cases is shown as “-”. Zero is also shown as “-”, so you cannot tell whether a “-” is 0 or 1 to 9.
In the FY2024 cases-by-MDC table, 73.6% of cells are “-”. The disease-and-surgery table is finer still: 97.4% of its count cells are “-”, and only 2.6% show a number. Suppression concentrates in small hospitals and in MDCs and diseases with few patients.
6-3. Notification numbers are reassigned every year
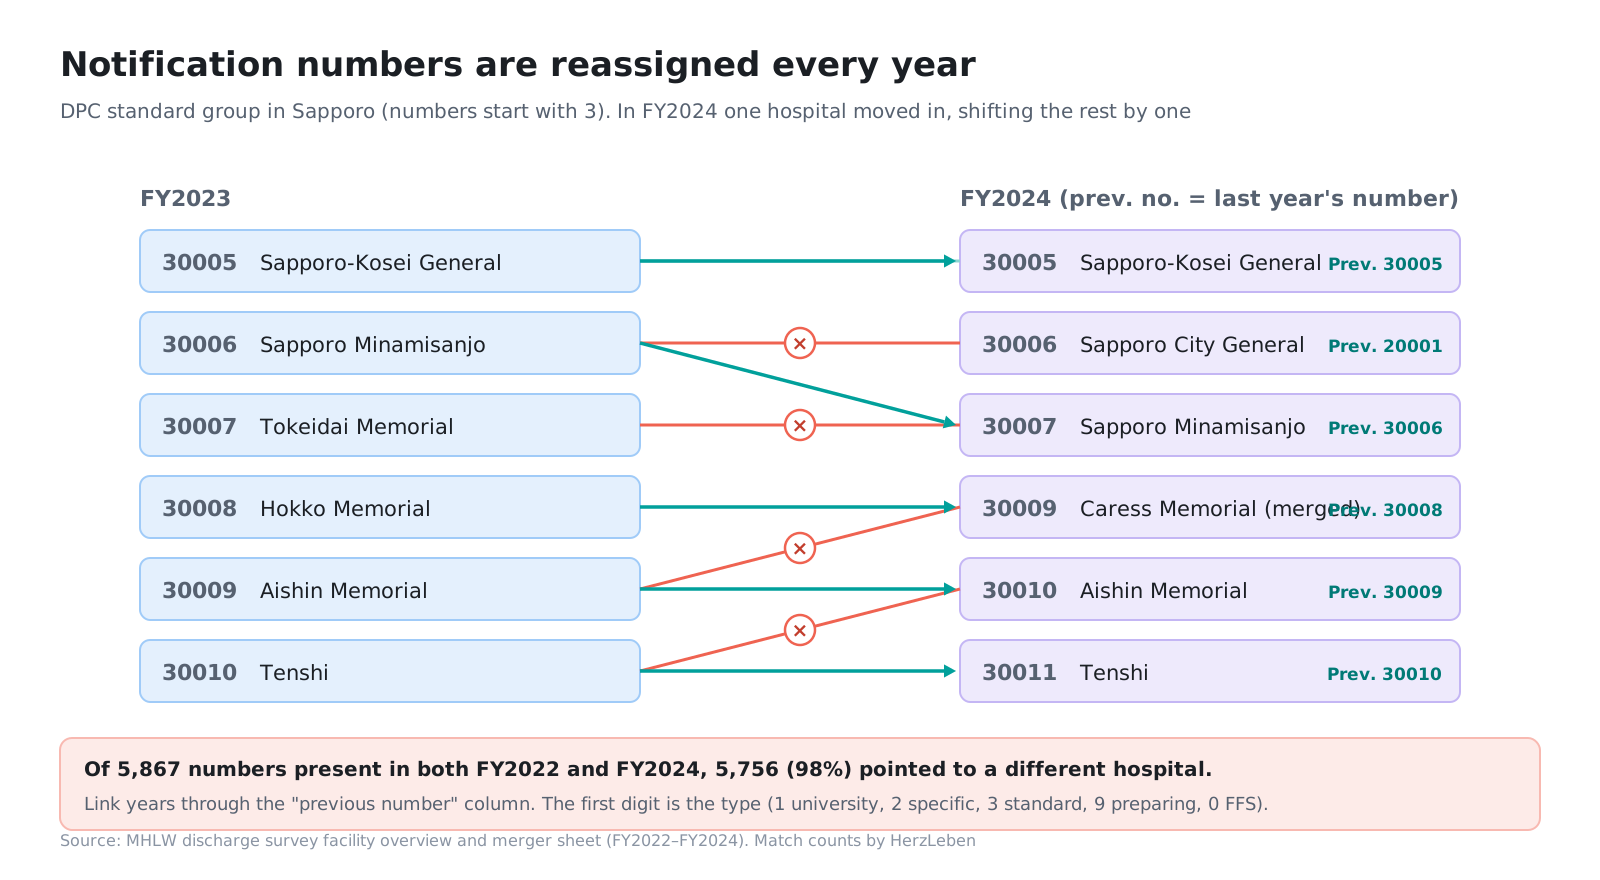
The notification number that identifies a hospital is reassigned every year. It is a running number within each hospital type, and the first digit gives the type (1 university main, 2 DPC specific group, 3 DPC standard group, 9 DPC preparing, 0 fee-for-service). When a hospital joins or leaves partway through the list, every number after it shifts.
In the Sapporo example above, a city hospital moved from the specific group into the standard group in FY2024, so every number from 30006 on shifted down by one. Of the 5,867 numbers present in both FY2022 and FY2024, 5,756 (98%) pointed to a different hospital.
To link years, follow the previous number column in the facility overview. In FY2024, 6,261 of 6,372 hospitals link to the previous year; the remaining 111 have “-” there and are new participants.
6-4. Merged and split hospitals
Hospitals that merged or split during the year are listed on a separate sheet of the facility overview, “Handling of merged and split institutions.” FY2024 had five:
| When | Type | What happened |
|---|---|---|
| Nov 2024 | Split | Amagasaki Chuo Rehabilitation Hospital split from Amagasaki Chuo Hospital |
| Dec 2024 | Split | Fuchu Hospital (Osaka) split into Izumiotsu Medical Center and Fuchu Hospital |
| Jan 2025 | Merger | Osaka Police Hospital and the Second Osaka Police Hospital merged |
| Apr 2025 | Merger | Hokko Memorial Hospital and Tokeidai Memorial Hospital merged into Caress Memorial Hospital |
| Apr 2025 | Merger | Niigata Prefectural Rheumatic Center merged into Niigata Prefectural Shibata Hospital |
In a merger year, the same notification number appears in two sets of rows (some months before the merger and some after). To view the hospital as one, add the two sets, but if either is suppressed the total is not certain. The dashboard adds only the visible numbers, puts a “+” on the upper right of the number and shows the possible range (in CSV exports, “at least N”).
6-5. The medical-area table counts by patient address
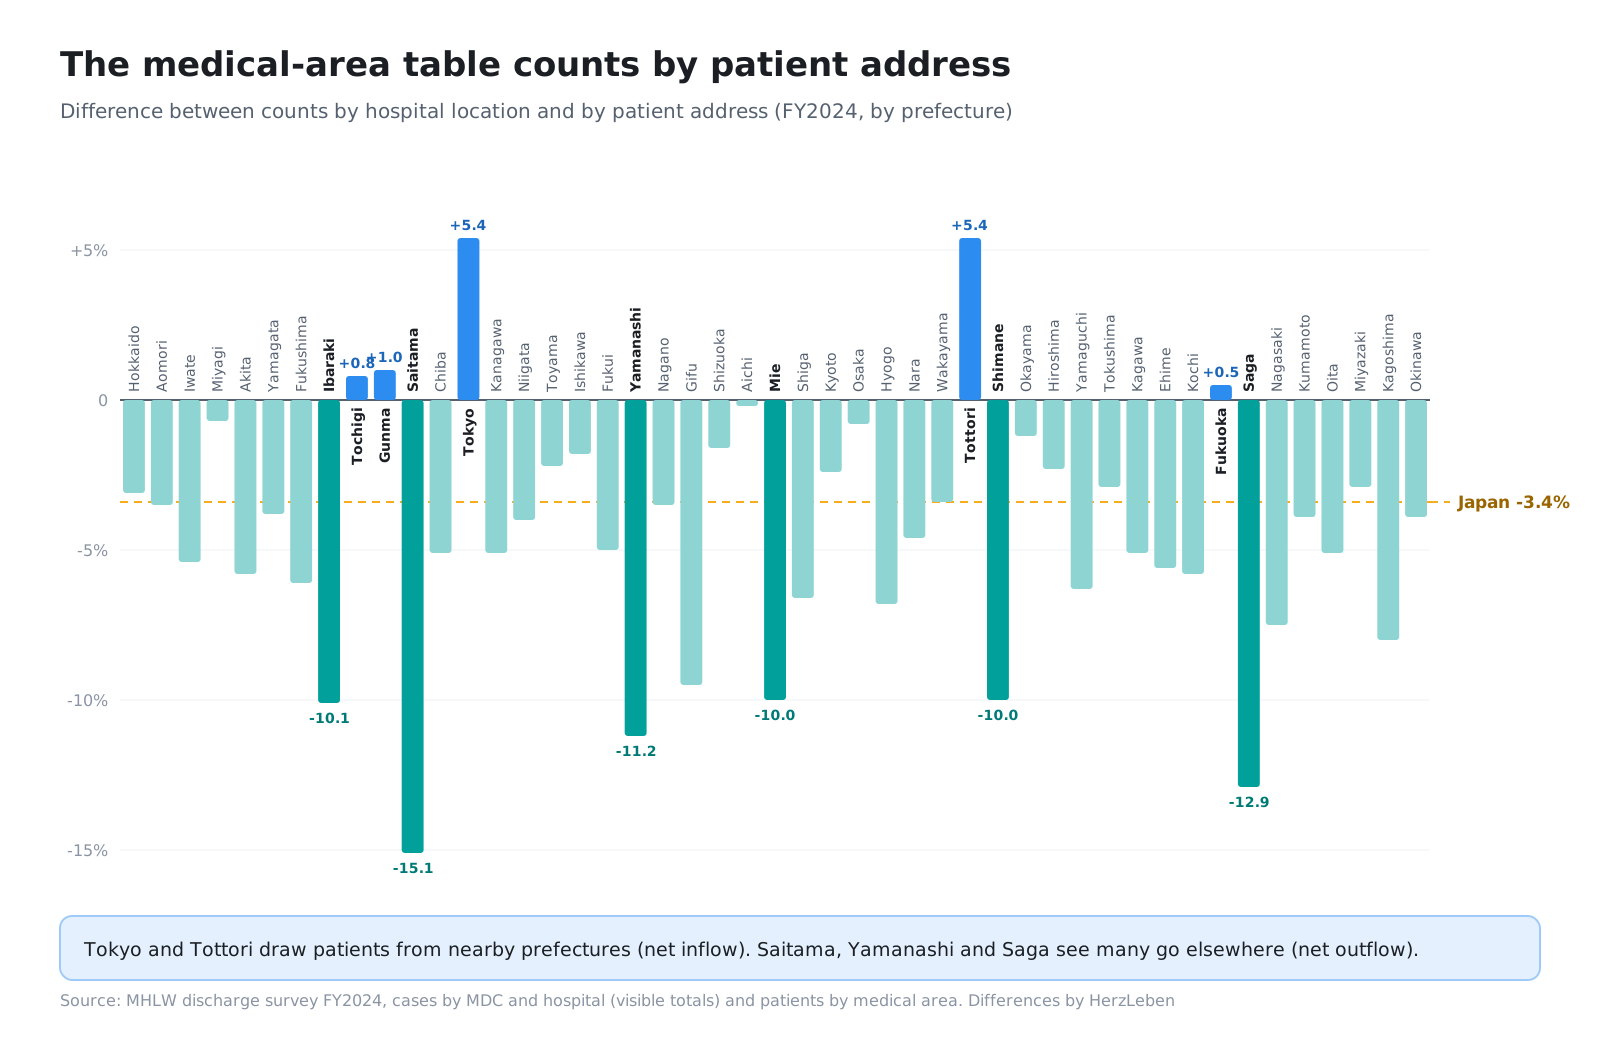
Reference 1’s “Patients by medical area and MDC” table gives patient counts per secondary medical area. Its name suggests it counts by hospital location, but it counts by the patient’s address postal code in Form 1. When a postal code spans more than one secondary medical area, the case is counted in each.
Compared with counts by hospital location (the visible totals in the hospital tables), each prefecture differs. Nationwide, the visible hospital-side total is 3.4% lower. Against that line, Tokyo (+5.4%) and Tottori (+5.4%) draw patients from neighboring prefectures (net inflow), while Saitama (−15.1%), Saga (−12.9%) and Yamanashi (−11.2%) see many residents treated elsewhere (net outflow). Using this table to check hospital counts will be off by exactly that cross-border care.
6-6. The previous year is re-tabulated in the next report
Many survey tables show the previous year next to the current one. The previous year’s figures are re-tabulated under the current year’s rules (such as the code version). For example, the FY2023 count for university main hospitals is 1,358,219 in the FY2023 report and 1,366,161 in the FY2024 report.
When lining up several years, be consistent about which year’s report each number comes from. The dashboard takes each year’s figures from that year’s own report.
6-7. Files can be replaced after release
The FY2024 results page carries a note: “Data replaced because some hospitals’ notification numbers were wrong (June 30, 2026).” The files were swapped three months after release.
If you keep using a file you downloaded earlier, you keep the pre-correction data. Record the download date and check the page notes before using the data.
6-8. Limits of a hospital-level survey
- Patients cannot be followed: counts are per hospital, so a patient transferred to another hospital is counted separately at each
- Inpatient only: outpatient care (outpatient chemotherapy, day procedures and so on) is not included
- Some hospitals do not submit data: about 20% of Japan’s hospitals are not in the survey
- Case volume is not quality: a high case count does not indicate quality of care or that one hospital is better than another. It varies widely with hospital size, role and local population
7. What this data can and cannot tell you
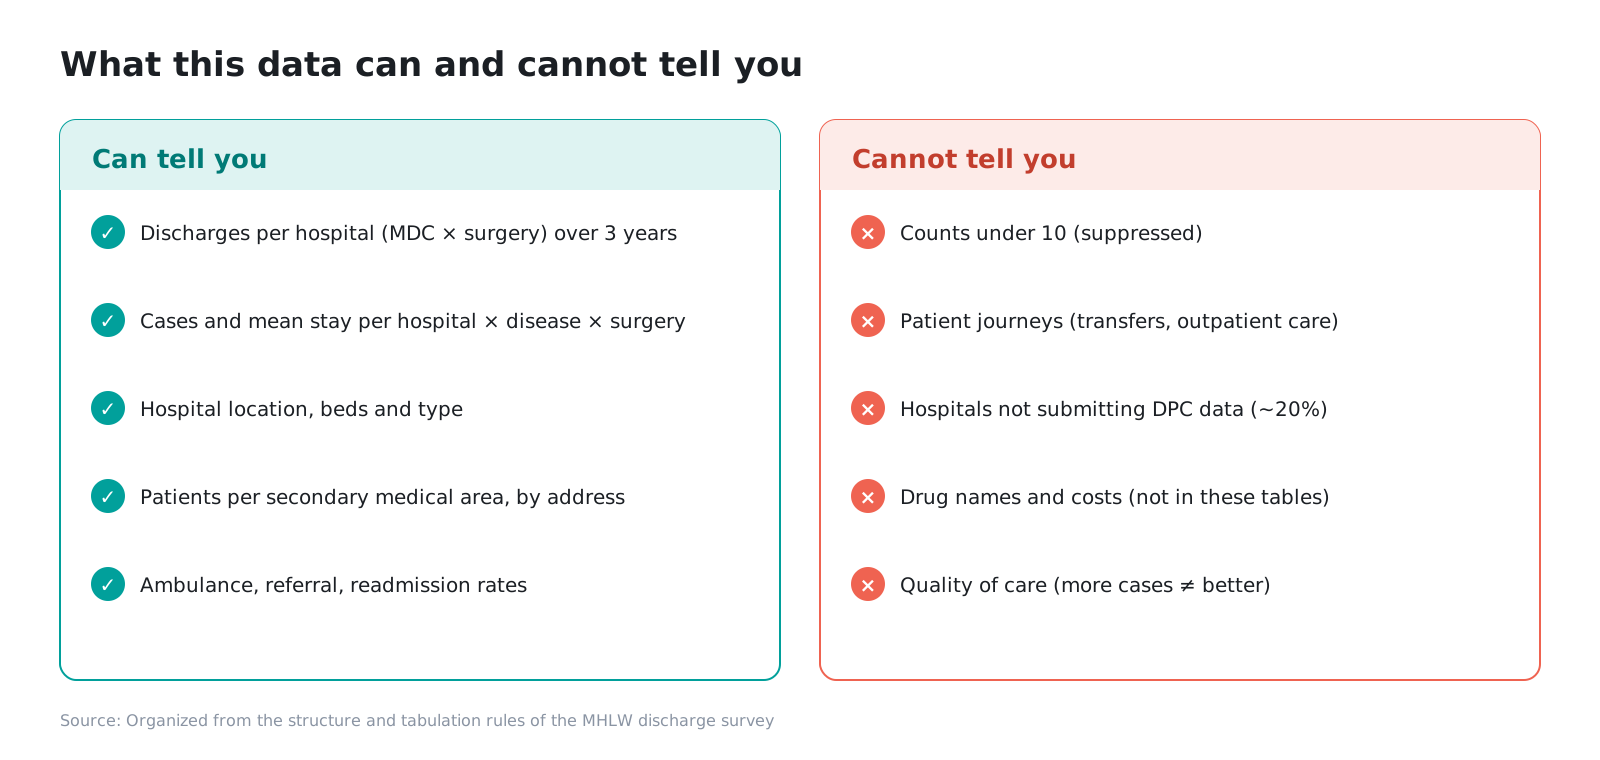
No other free data shows annual inpatient volume per hospital, by disease and surgery, for about 80% of Japan’s hospitals. On the other hand, this open data cannot show patient journeys or the breakdown of counts under 10. For that you would need third-party access to the NDB (National Database of Health Insurance Claims and Specific Health Checkups) or data from a commercial healthcare data vendor.
8. Primary sources
- FY2024 discharge survey results — facility overview, References 1–3, tabulation PDFs
- FY2023 / FY2022 results
- Reference 1 “Data analyzed” — tabulation period, excluded cases, number of hospitals
- Reference 2 “Tabulation conditions” — the suppression rule, how surgery yes/no is counted, the definition of 97 restated
- DPC electronic fee schedule — the 14-digit code, surgery branch names, per-day rates
- Iryo Joho Net open data — hospital locations (latitude and longitude), used for the dashboard map
9. Summary
- DPC is Japan’s inpatient payment system that sets a per-day rate for each combination of diagnosis and surgery or procedures (the DPC code). The discharge survey is the government’s tabulation of the data hospitals submit to evaluate it: 6,372 hospitals and about 11.76 million discharges in FY2024
- It shows case counts per hospital by MDC × surgery yes/no (three years) and by disease (6-digit) × surgery (FY2024). Anyone can download it free of charge
- Four points prevent most misreadings: (1) the year is set by discharge date, and FY2024 runs June to May; (2) “-” means under 10 or zero, so never add it as zero; (3) notification numbers are reassigned every year, so link years through the previous number; (4) the medical-area table counts by patient address
Next step
The main articles in this series use this data to test whether an in-house BI dashboard can be turned into an “AI dashboard you can talk to.” The overview is in “Part 0: Overview and Design.”
The demo app built on this data is live at dpc.herzleben.co.jp. If you would like to turn your in-house BI into an AI-powered tool, tell us through the contact form.
Sources
- MHLW, Results of the FY2024 Survey for the Evaluation and Verification of DPC: Discharge Survey (published March 30, 2026; data replaced June 30, 2026). https://www.mhlw.go.jp/stf/shingi2/newpage_00203.html
- MHLW, Results of the FY2023 Survey on the Impact of DPC Introduction: Discharge Survey. https://www.mhlw.go.jp/stf/shingi2/newpage_00137.html
- MHLW, Results of the FY2022 Survey on the Impact of DPC Introduction: Discharge Survey. https://www.mhlw.go.jp/stf/shingi2/newpage_39119.html
- Same pages: Reference 1 "Data analyzed", Reference 2 "Tabulation conditions", FY2024 discharge survey summary paper
- MHLW, DPC electronic fee schedule, FY2024 fee revision (updated May 20, 2025). https://www.mhlw.go.jp/stf/seisakunitsuite/bunya/0000198757_00008.html
- MHLW, Survey of Medical Institutions (end of May 2025, preliminary). https://www.mhlw.go.jp/toukei/saikin/hw/iryosd/m25/is2505.html
- MHLW, Iryo Joho Net open data (as of June 1, 2026). https://www.mhlw.go.jp/stf/seisakunitsuite/bunya/kenkou_iryou/iryou/newpage_43373.html
- The figures and tables on this page were prepared by HerzLeben Inc. from the sources above; they were not produced by the Japanese government. All numbers were checked against files downloaded on October 23, 2026