
Claude Code × Medical Application
[Claude Code] Turning an In-House BI Dashboard into an AI Dashboard, Part 1: Preparing the Data — Reconciling Years, Hospitals and Regions
1. Introduction — the data trips you up first
In Part 0, we gave an overview of turning an in-house BI dashboard into “an AI dashboard that responds when you talk to it.” From Part 1 on, we look at how it was built, one piece at a time.
When you rebuild in-house BI, the first thing that trips you up is not the screens or the AI. It is the data.
- When the year changes, hospital or product numbers are reassigned
- The same hospital is written differently in each system
- The boundaries of sales areas or territories change partway through
- Some values are not shown, because of permissions or small counts
The MHLW DPC open data we used has all four. What the data contains is summarized on the reference page “Japan’s DPC Open Data,” so this post focuses on how we reconciled it and how we handed that work to Claude Code.
- 3yearslinking FY2022–FY2024. Hospital numbers are reassigned every year
- 6,448hospitalstook part in at least one of the three years. Map locations are assigned by name
- 330areassecondary medical areas. The only nationwide lookup table is an old edition
- 2.6%share of cells in the cases-by-surgery table that show a number. The rest are undisclosed
Here is how this post is organized.
- Introduction (this section)
- What we wrote before handing over the work — CLAUDE.md
- How one stage runs — “Go ahead with 1” and review
- Reconciling years
- Reconciling hospitals — stopping hospital matching at “good enough”
- Reconciling regions
- Keeping values that are not shown
- Shaping the data for the screens
- This post’s harness / Summary
2. What we wrote before handing over the work — CLAUDE.md
Claude Code reads the project’s CLAUDE.md before every task. What is written there becomes, for Claude Code, “the premises of this job.” This time CLAUDE.md was about 170 lines, arranged in this order.
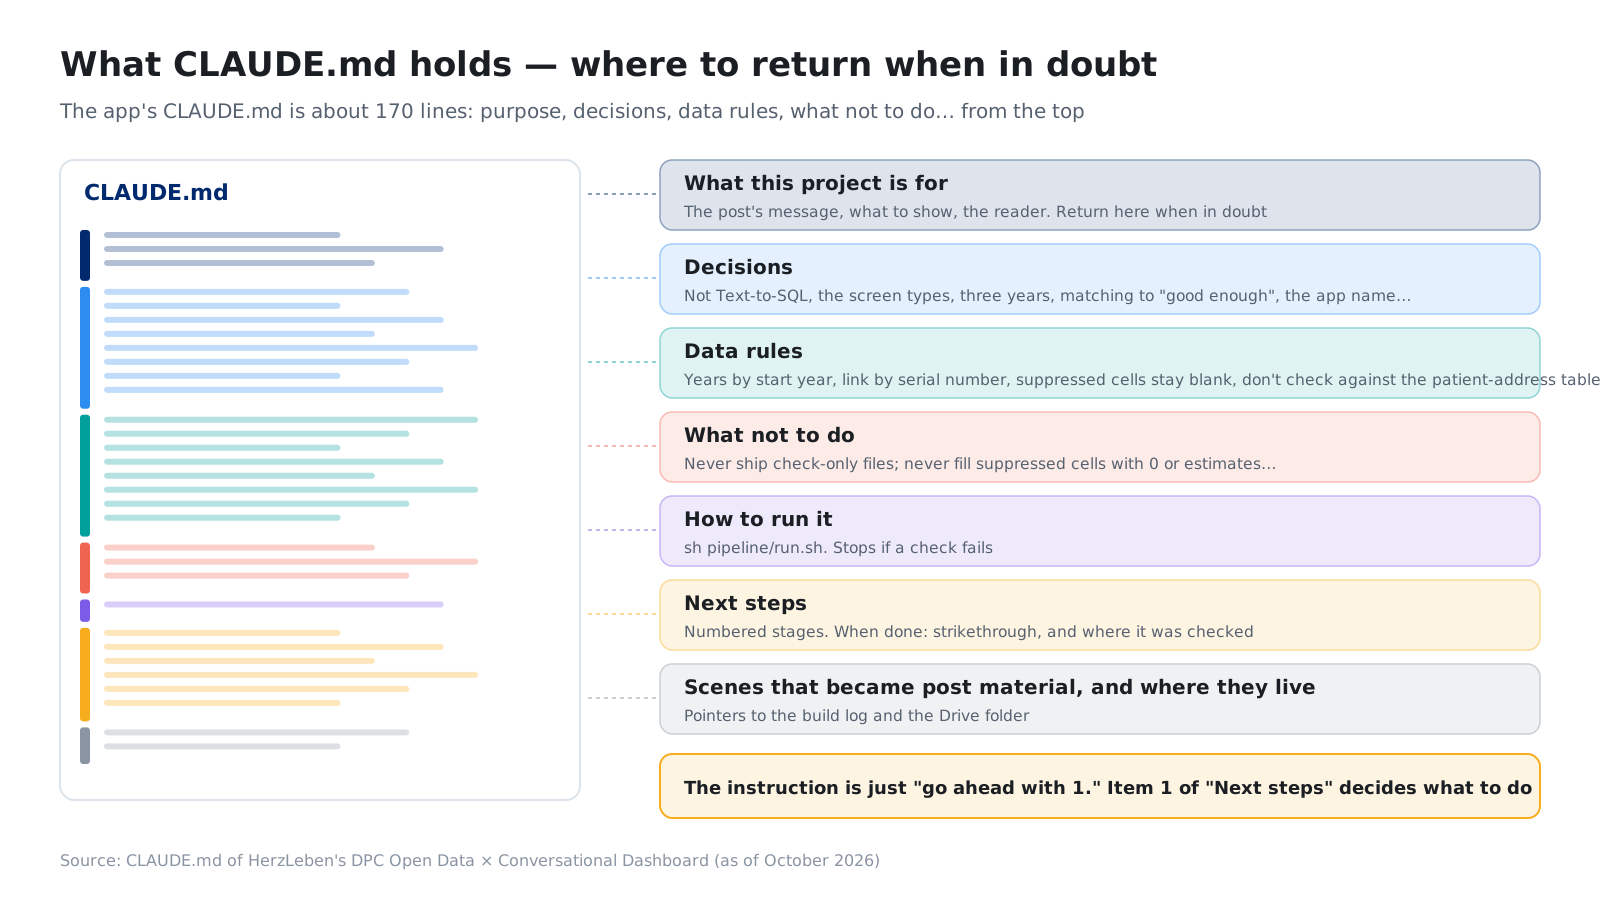
We paid attention to three things when writing it.
- Put the goals at the very top. “The article’s message is that this can replace BI.” “What we want to show is the build process.” When Claude Code is unsure about a detailed decision, it comes back here to choose
- Write what not to do, together with the reasons. “Do not fill undisclosed values with 0 or estimates.” “Do not put files meant only for checks into the published output.” With a reason attached, Claude Code makes the same call in similar situations that are not written down
- Number the next steps. For finished items, we add a strikethrough and note where they were checked. That way, the next instruction only needs to name a number
CLAUDE.md was not complete from the start. After each stage, we wrote back what we learned during the work, what the review pointed out and what a person decided, and let it grow (Section 3).
3. How one stage runs — “Go ahead with 1” and review
3-1. One loop per stage
For data preparation, we did the initial investigation and the map locations in a claude.ai conversation, then moved to Claude Code in VS Code from the import of the cases-by-surgery table onward. The unit of work we handed over was a “stage.” One stage finishes in one loop, as follows.
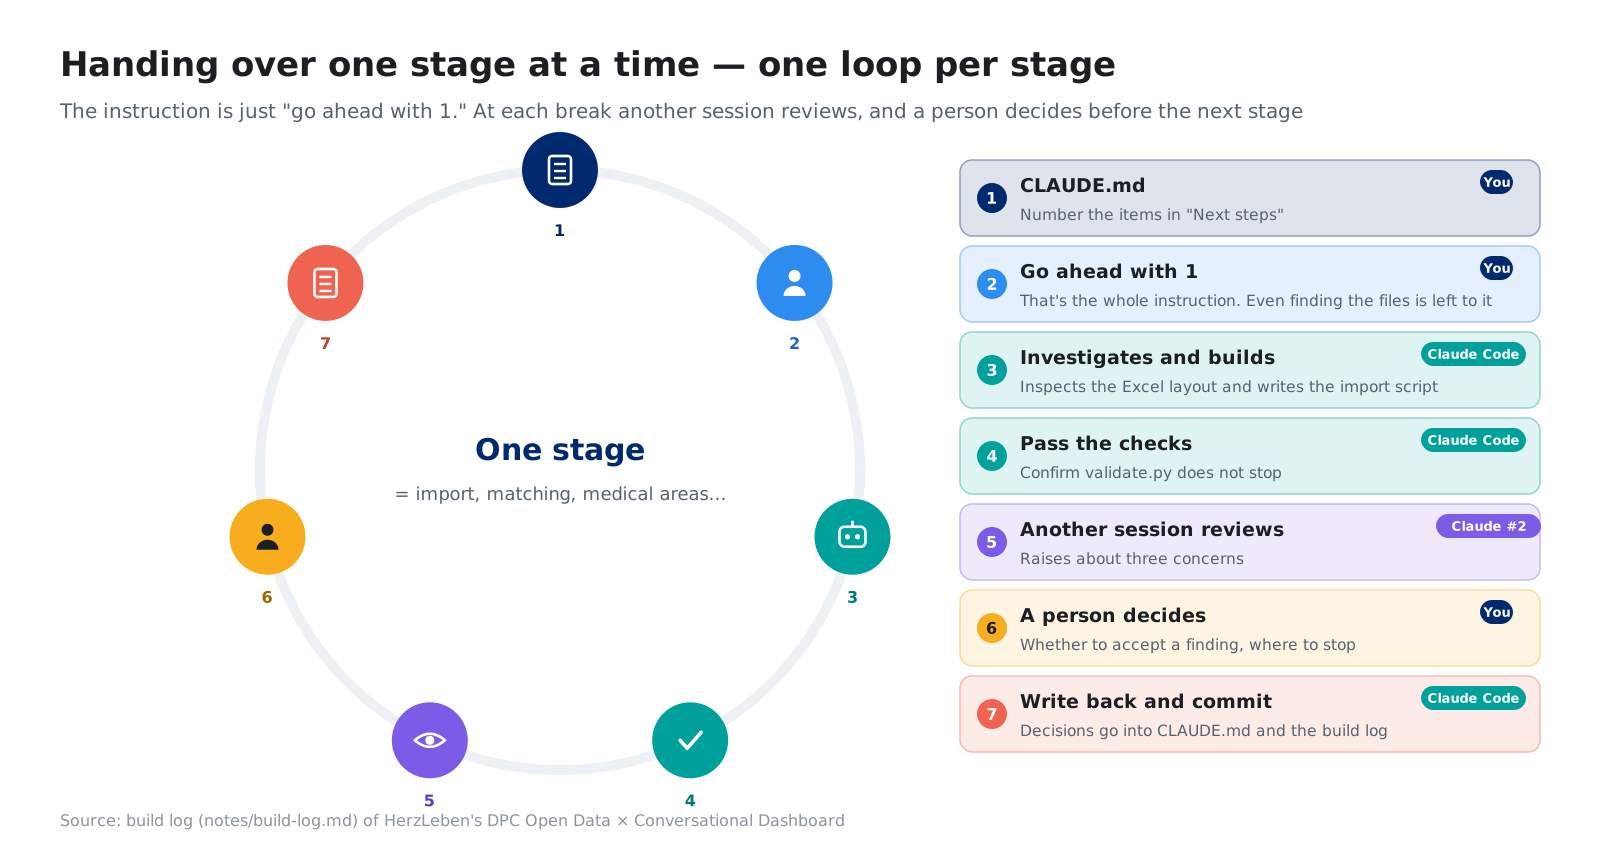
The whole flow is a single sh pipeline/run.sh, which runs end to end from download to checks. If even one check fails, it stops there.
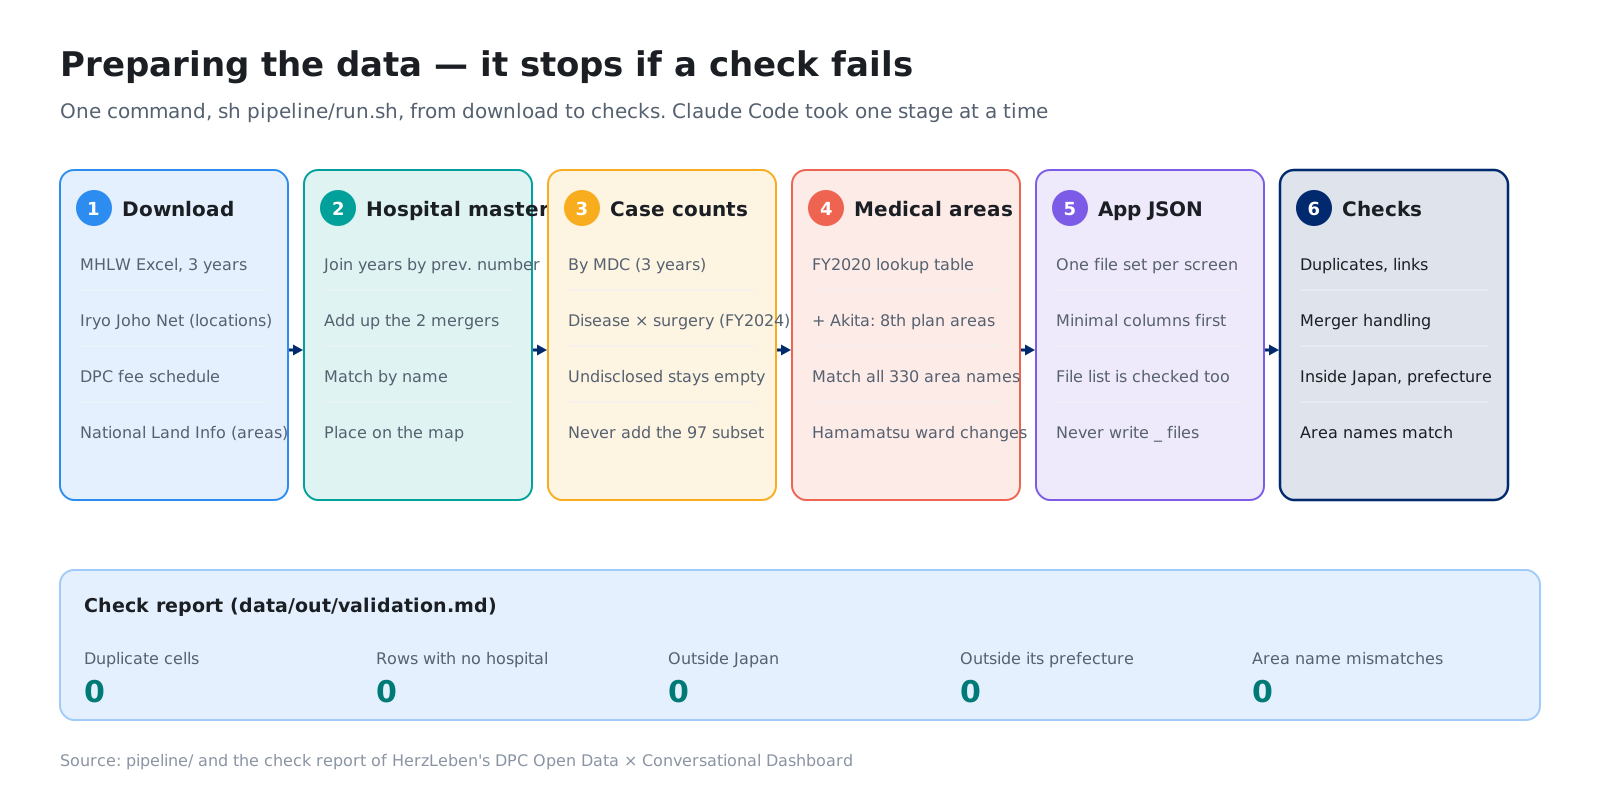
3-2. What happened with “Go ahead with 1”
When we imported the FY2024 cases-by-surgery table (cases by disease and surgery), the instruction was one sentence: “Go ahead with 1.” Item 1 under “next steps” was this import. Here is what Claude Code investigated and decided on its own, taken from the build log.
- It found the tables from the headings on the MHLW page and noticed that only MDC17 (mental disorders) had no file. It added a note to the source list
- It confirmed in one pass that all 17 files had the same shape. Case counts and length of stay always turn into “-” together, and every visible count is 10 or more
- It confirmed in the tabulation-conditions document that “97 (restated, excluding transfusion)” is a subset of 97, and decided not to add it as a separate branch
- Surgery branches (01, 02 …) have no names, so it took them from the DPC electronic fee schedule. The fee schedule was updated several times after the revision, so it chose the edition at the end of the survey period (May 2025). All 1,359 branches got names
- There was no Excel-reading library (openpyxl) available, so it created a working environment (
.venv) and maderun.shuse it
None of these were instructed by a person. The numbers in CLAUDE.md decided “what to do”; “how to investigate” was left to Claude Code.
3-3. What a person decided, and what Claude Code found
We did not leave everything to it. At each break, a person made decisions.
| What a person decided | What Claude Code found |
|---|---|
| Cover three years (FY2022–FY2024) | Hospital numbers are reassigned every year |
| Stop hospital matching at “good enough” | Name-similarity matching produced 28 mismatches |
| Trends at MDC level; disease × surgery for the latest year only | The cases-by-surgery table covers only diseases with surgery branches (23% for MDC08) |
| Whether the Akita regrouping, read from a figure in the prefecture’s documents, is acceptable | Akita is the only prefecture whose secondary medical area names changed |
The right column is factual findings; the left column is decisions about how far to go. The AI is fast at finding; the decisions stay with the person who knows the purpose. This division is built into each stage’s loop.
3-4. Having a separate session review
After each stage, we had Claude in a separate session review the work, not the Claude Code session that did it. Whoever built something finds it hard to doubt their own premises.
The review after the cases-by-surgery import raised three points.
- “No row = undisclosed” holds only when that hospital exists in that year. Before a hospital joins or after it closes, mark it separately as “no data”
- Write the edition of the fee schedule used for surgery names in a note on the screen
- Some prefectures revised their medical areas under the 8th Medical Care Plan. Use the edition whose area names match the DPC tables, and confirm it with a check
Rather than fixing the code right away, we first wrote the points back into the “data rules” in CLAUDE.md, then committed. That way the Claude Code in the next stage works from the same premises.
3-5. Having it keep a build log
Separately from CLAUDE.md, we had Claude Code write a build log, notes/build-log.md. It records only four items.
- What was asked
- The unit of work handed over
- Where a person stopped or corrected it
- The reasons for decisions
At first we meant it as material for the articles, but in practice it worked as a record for Claude Code itself to reread the decisions of earlier stages. Because “why we used the municipality’s representative point” and “why we do not add the 97 restatement” are written down, we do not have to repeat the same discussion when we look back later.
4. Reconciling years
4-1. Numbers are reassigned every year
To show three-year trends, the same hospital has to be linked across years. Comparing the hospital lists by year showed that the hospital number (notification number) is reassigned every year. Of the numbers present in both FY2022 and FY2024, 98% pointed to different hospitals.
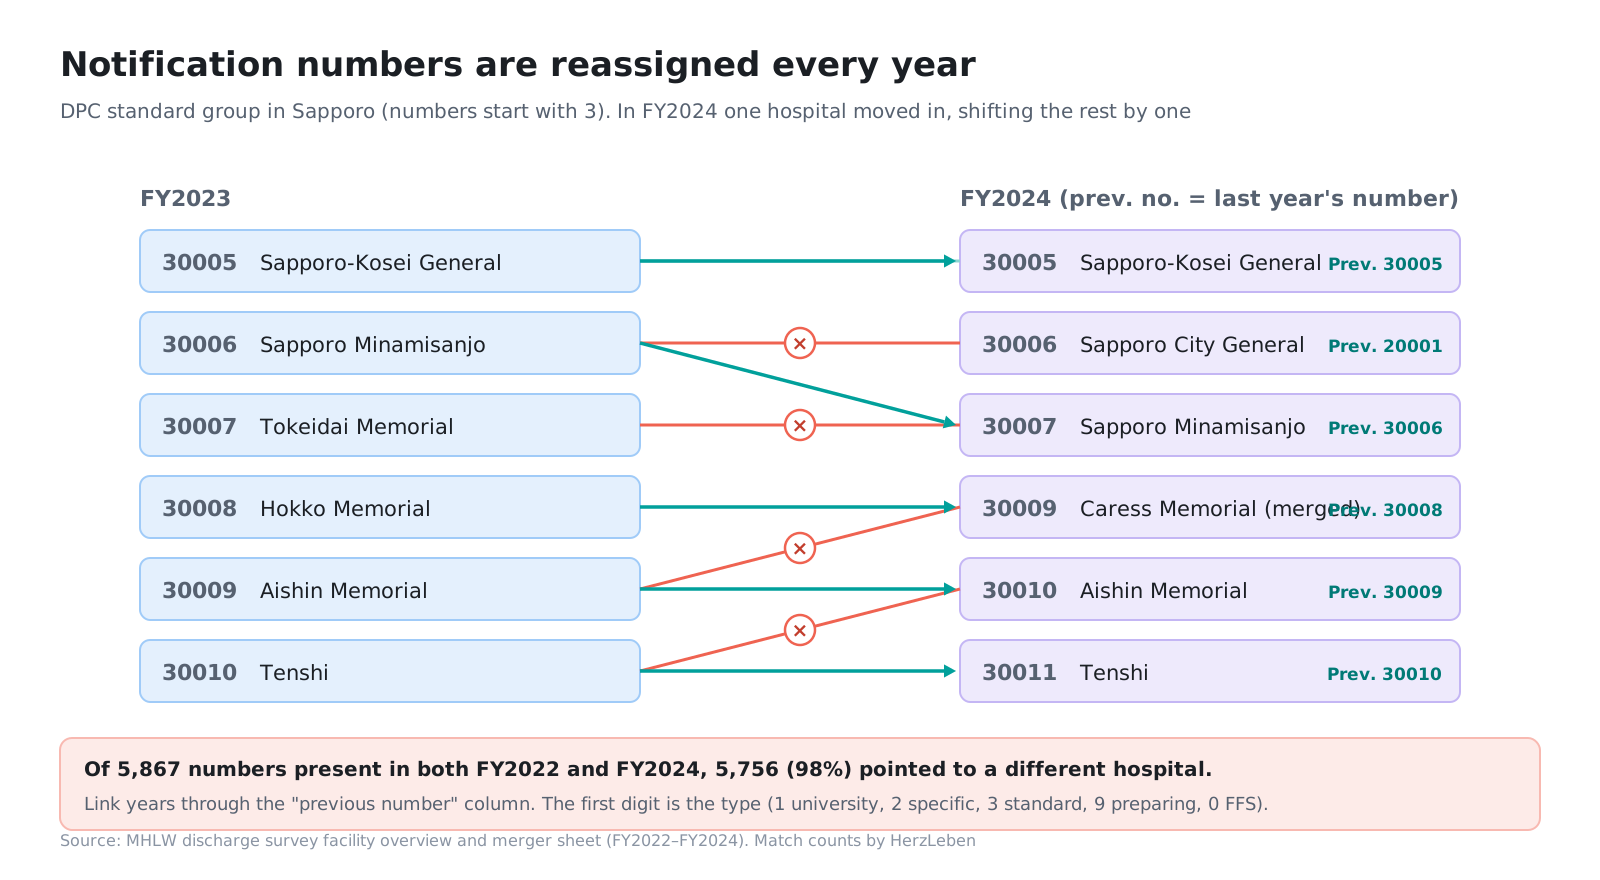
We also tried linking by name, but around 100 hospitals change their names every year (for example Tokyo Medical and Dental University Hospital → Institute of Science Tokyo Hospital), and they become different hospitals. Reading the table notes, we found a column: “previous number = last year’s notification number.” Following it links more than 98%.
In company data, this is like customer codes being reassigned, or numbers changing when a core system is replaced. Look for an old-to-new lookup table first, not names.
4-2. Mergers: add the two sets
We also found two merged hospitals. In the same year, the months before and after the merger appear as separate rows. We add them together, and if either is undisclosed, we treat the total as “at least N.” On screen, we put a small “+” at the upper right of the number (covered in Part 2).
4-3. The survey years cover different periods
Only FY2024 covers June 2024 to May 2025 (FY2022 and FY2023 run April to March). This is because the fee revision took effect in June, and discharges in April–May 2024 fall into no year. We left the data unchanged and decided to show a note on the trend screen. The note text is not hard-coded into the screen; it lives in a settings file kept with the data (meta.json).
5. Reconciling hospitals — stopping hospital matching at “good enough”
5-1. Placing hospitals by municipality was rejected
The MHLW tables have neither addresses nor coordinates for hospitals. At first we considered placing each hospital at its municipality’s representative point. When we checked, though, only 433 of about 6,400 hospitals were the only hospital in their municipality, and in Kagoshima City 67 hospitals would overlap at one point. It was unusable as a map, so we rejected it.
5-2. Within the same municipality, strongest evidence first
Instead, we matched hospital coordinates from the Iryo Joho Net (Navii) open data by name, only within the same municipality. We confirmed matches one-to-one, starting with the strongest evidence: exact name matches first, then matches after removing the corporate name, and so on.
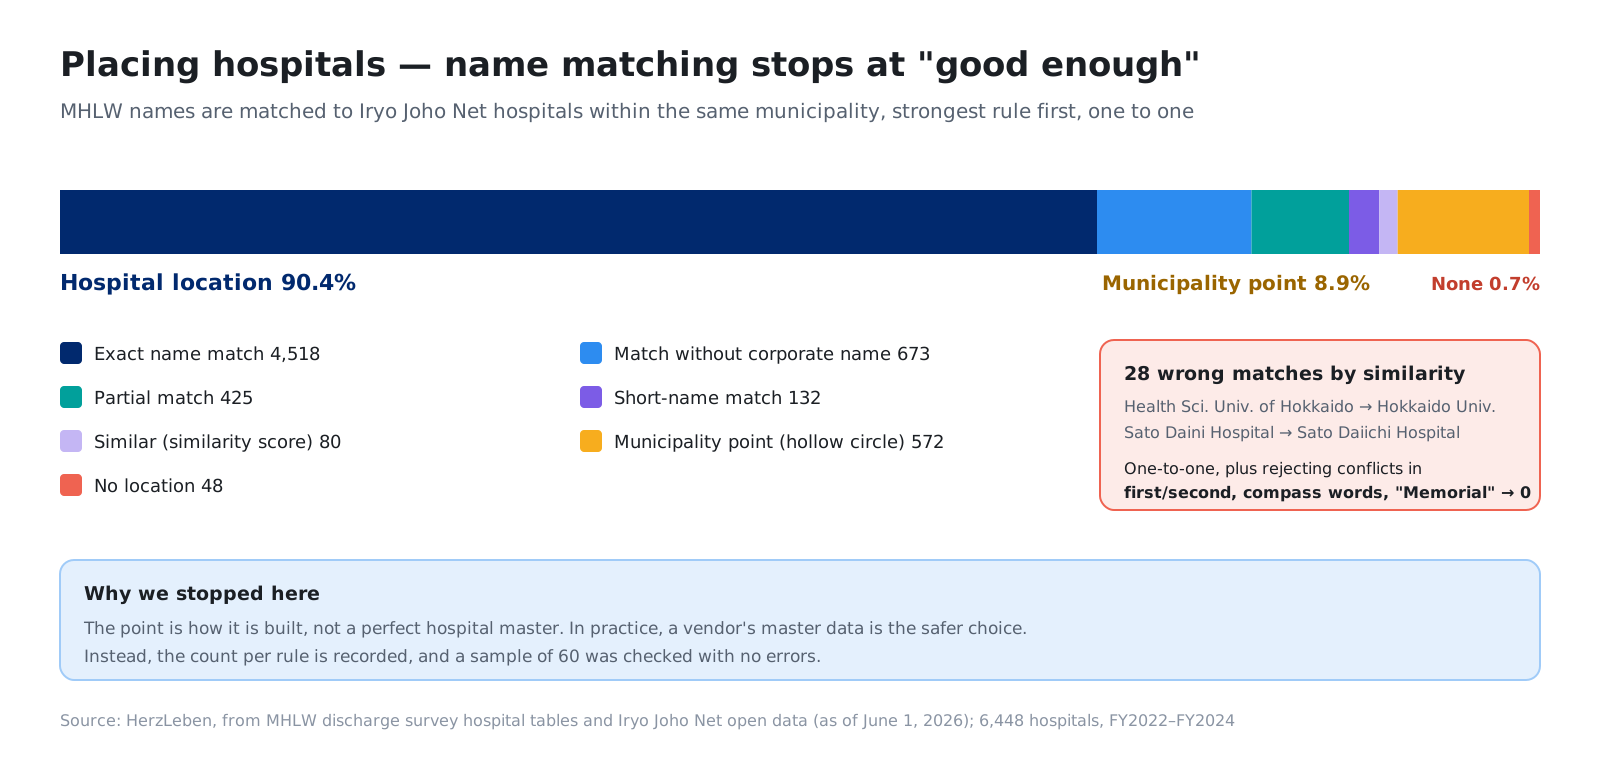
In the first run, the name-similarity rule produced 28 mismatches. These were errors like 北海道医療大学病院 (Health Sciences University of Hokkaido Hospital) being linked to 北海道大学病院 (Hokkaido University Hospital), whose Japanese names differ by only two characters, or 佐藤第二病院 (Sato “Second” Hospital) to 佐藤第一病院 (Sato “First” Hospital). We changed it to confirm matches one-to-one, and excluded pairs whose distinguishing words disagree, such as “first / second,” “east / west / south / north” and “memorial.” That brought it to zero. Finally, we sampled 60 matches and confirmed there were no errors.
5-3. Why we stopped at “good enough”
Hospitals that cannot be matched by name are placed at the municipality’s representative point (an open circle on the map). We stopped here because what this series wants to show is how it was built, not a finished hospital master. We kept the reason for stopping and the counts per rule in a table.
6. Reconciling regions
To compare regions by “secondary medical area,” you need a table mapping municipalities to medical areas. However, the latest medical-area data in National Land Numerical Information (A38) is the FY2020 edition (7th Medical Care Plan), and we could not find a nationwide table for the 8th plan.
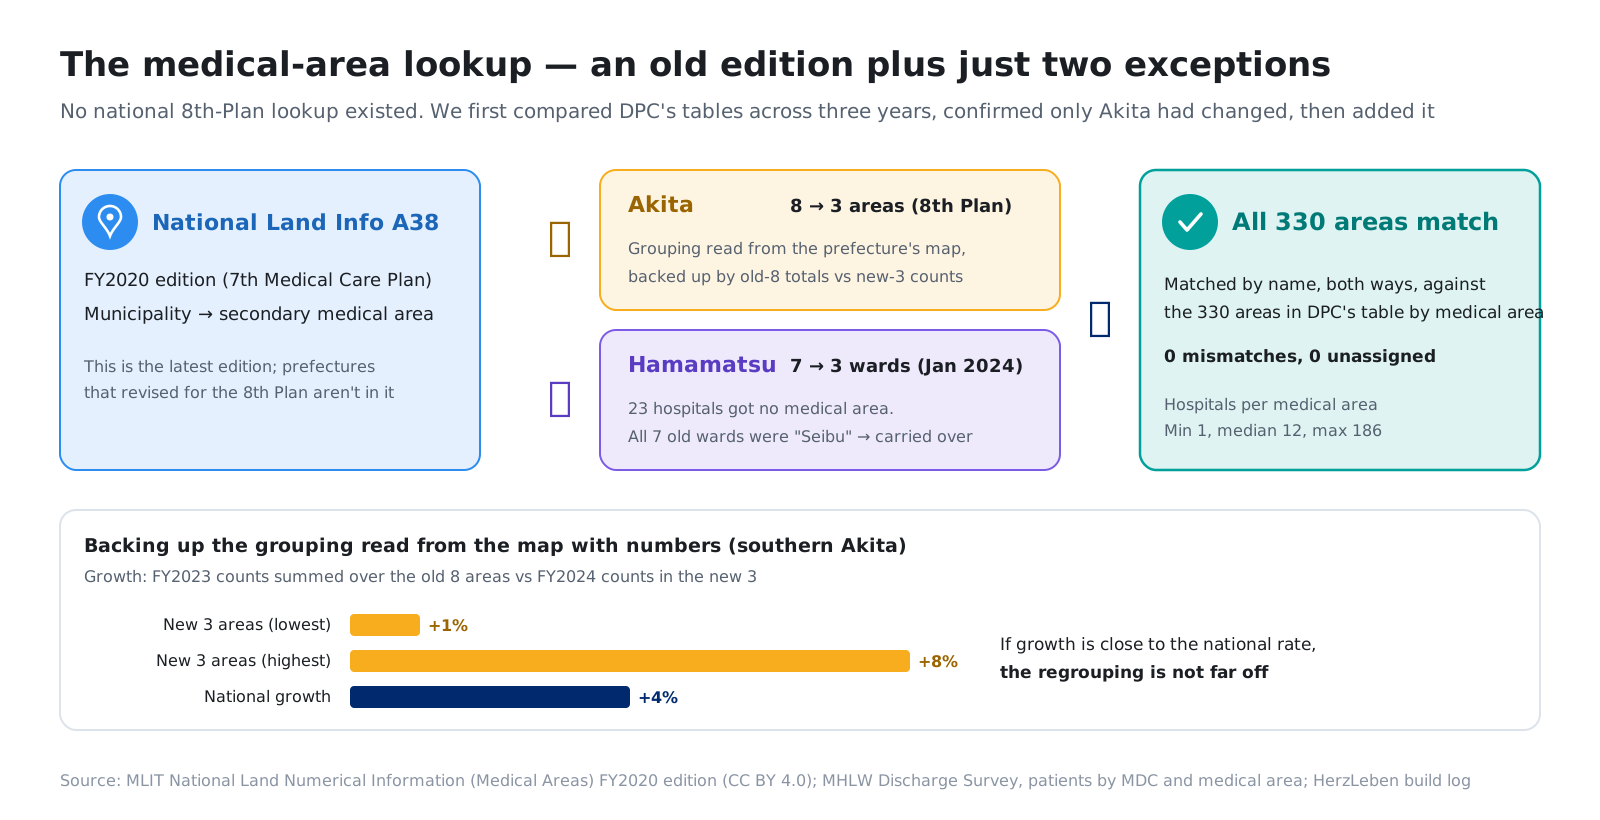
Here, instead of searching on for a lookup table, Claude Code first compared the DPC tables by medical area across three years. Akita was the only prefecture whose medical area names changed (8 areas → 3). It concluded that “adding only the Akita regrouping to the old edition is enough,” and confirmed that the names of all 330 areas nationwide match in both directions with no spelling variations.
The other exception was Hamamatsu City. Twenty-three hospitals had no medical area, and on investigation they carried new municipality codes, not in the old edition, from the January 2024 ward reorganization (7 wards → 3). We confirmed that all seven former wards belonged to the “Seibu” medical area and carried that over.
The review also pointed out that “boundaries can change even when the name stays the same.” We added a check that lists areas whose change in case counts deviates sharply from the national figure. What it found is covered in Part 2.
7. Keeping values that are not shown
7-1. No rows for undisclosed cells
In the DPC open data, cells with fewer than 10 cases or zero are masked with “-”. In the cases-by-surgery table, only about 227,000 of about 8.66 million cells show a number: 2.6%.
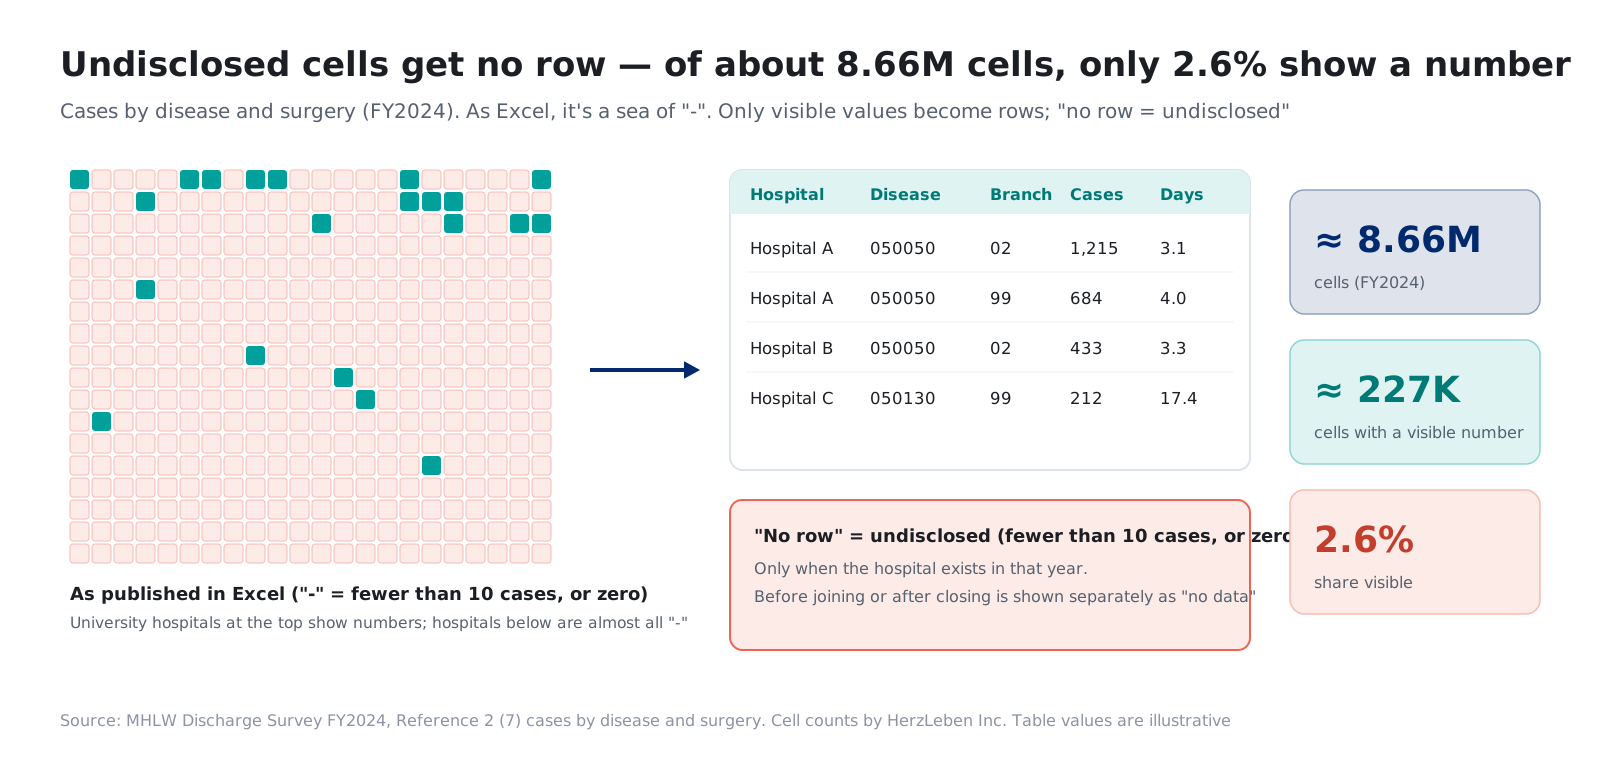
Kept in Excel form, it becomes a huge table that is almost all “-”. So we chose a layout that keeps only visible values as rows and creates no row for undisclosed cells. The README states “no row = undisclosed (fewer than 10 cases, or zero),” and, as the review in 3-4 pointed out, cases where the hospital does not exist in that year are marked separately as “no data.”
Undisclosed values are not added as zero, and not filled with estimates. This rule is first in the “things not to do” section of CLAUDE.md. With company data too, filling values hidden by permissions, or missing values, with zero makes totals look plausible but wrong.
7-2. Spotting rows that must not be added
The cases-by-surgery table has a row “97 (restated, excluding transfusion),” which is a subset of 97 (other surgery). Adding it double-counts. Claude Code confirmed this in the tabulation-conditions document, then backed it up with a check. For each hospital × MDC, it tested whether the sum of visible counts by surgery exceeded the possible upper bound from the cases-by-MDC table; there were zero violations. This check also confirmed the reading that “the 97 restatement falls on the with-surgery side.”
One more point: the cases-by-surgery table includes only diseases with defined surgery branches. For skin (MDC08), only 23% of cases appear. Showing this table as “the MDC breakdown” would mislead, so we decided not to present it that way on screen (see the figure on the reference page).
8. Shaping the data for the screens
Finally, we decided the shape of the data the screens read. We compared running a database in the browser (DuckDB-Wasm) with JSON split by screen, and chose JSON.
| DuckDB-Wasm | JSON per screen | |
|---|---|---|
| Free-form aggregation | SQL can be written in the browser | Not possible (prepared screens only) |
| First load on a phone | Several MB for the engine alone; heavy | Reads only the files needed |
| Calculation needed here | — | Additions on the order of hospitals × 18 MDCs are enough |
The screens are fixed, and the AI does not write SQL but only picks conditions (Part 3), so the power of free-form aggregation is not needed. The app data is rebuilt from scratch every time, and the script checks that the list of files written matches the actual files, and that no working files starting with _ are mixed in.
9. This post’s harness
| Tool | What it is in this project | Role |
|---|---|---|
| Project document | CLAUDE.md (goals, rules, prohibitions, next steps) |
The premises for every task. Instructions just name a number |
| Build log | notes/build-log.md |
Keeps the reasons for decisions, to reread later |
| End-to-end procedure | pipeline/run.sh |
One run from download to checks. Stops on failure |
| Review | Claude in a separate session | Challenges premises the builder finds hard to doubt |
| Human judgment | Scope, where to stop hospital matching, whether to accept review points | Held by the person who knows the purpose |
10. Summary
- When rebuilding in-house BI, the data trips you up first. The four issues, reassigned numbers, inconsistent names, changing boundaries and values that are not shown, were all present in the DPC open data
- We wrote the goals, rules, prohibitions and next steps in
CLAUDE.md, and the instruction was one sentence: “Go ahead with 1.” How to investigate was left to Claude Code - After each stage, a separate session reviewed the work, and review points were written back into
CLAUDE.mdbefore committing - We stopped hospital matching at “good enough” and kept the reasons and the breakdown. Undisclosed values were not filled with zero; instead, no rows were created for them
What you can hand over grows as far as the premises you have written down.
Next step
Part 2 covers how we ensured the correctness of the numbers in the reconciled data: adding checks that stop the pipeline to the check script, how 305 hospitals ended up in the sea when we drew the map even though the tests and the count reconciliation had all passed, and how to present correct numbers so they are not misread.
Sources
- MHLW, Results of the FY2024 Survey for the Evaluation and Verification of DPC: Discharge Survey (published March 30, 2026; data replaced June 30, 2026). https://www.mhlw.go.jp/stf/shingi2/newpage_00203.html
- MHLW, Results of the FY2023 Survey on the Impact of DPC Introduction: Discharge Survey. https://www.mhlw.go.jp/stf/shingi2/newpage_00137.html
- MHLW, Results of the FY2022 Survey on the Impact of DPC Introduction: Discharge Survey. https://www.mhlw.go.jp/stf/shingi2/newpage_39119.html
- MHLW, DPC electronic fee schedule, FY2024 fee revision (updated May 20, 2025). https://www.mhlw.go.jp/stf/seisakunitsuite/bunya/0000198757_00008.html
- MHLW, Iryo Joho Net open data (as of June 1, 2026). https://www.mhlw.go.jp/stf/seisakunitsuite/bunya/kenkou_iryou/iryou/newpage_43373.html
- MLIT, National Land Numerical Information: Medical Areas, FY2020 edition (CC BY 4.0). Akita Prefecture regrouped into the three areas of the 8th Medical Care Plan
- The figures and tables in this post were prepared by HerzLeben Inc. from the sources above; they were not produced by the Japanese government