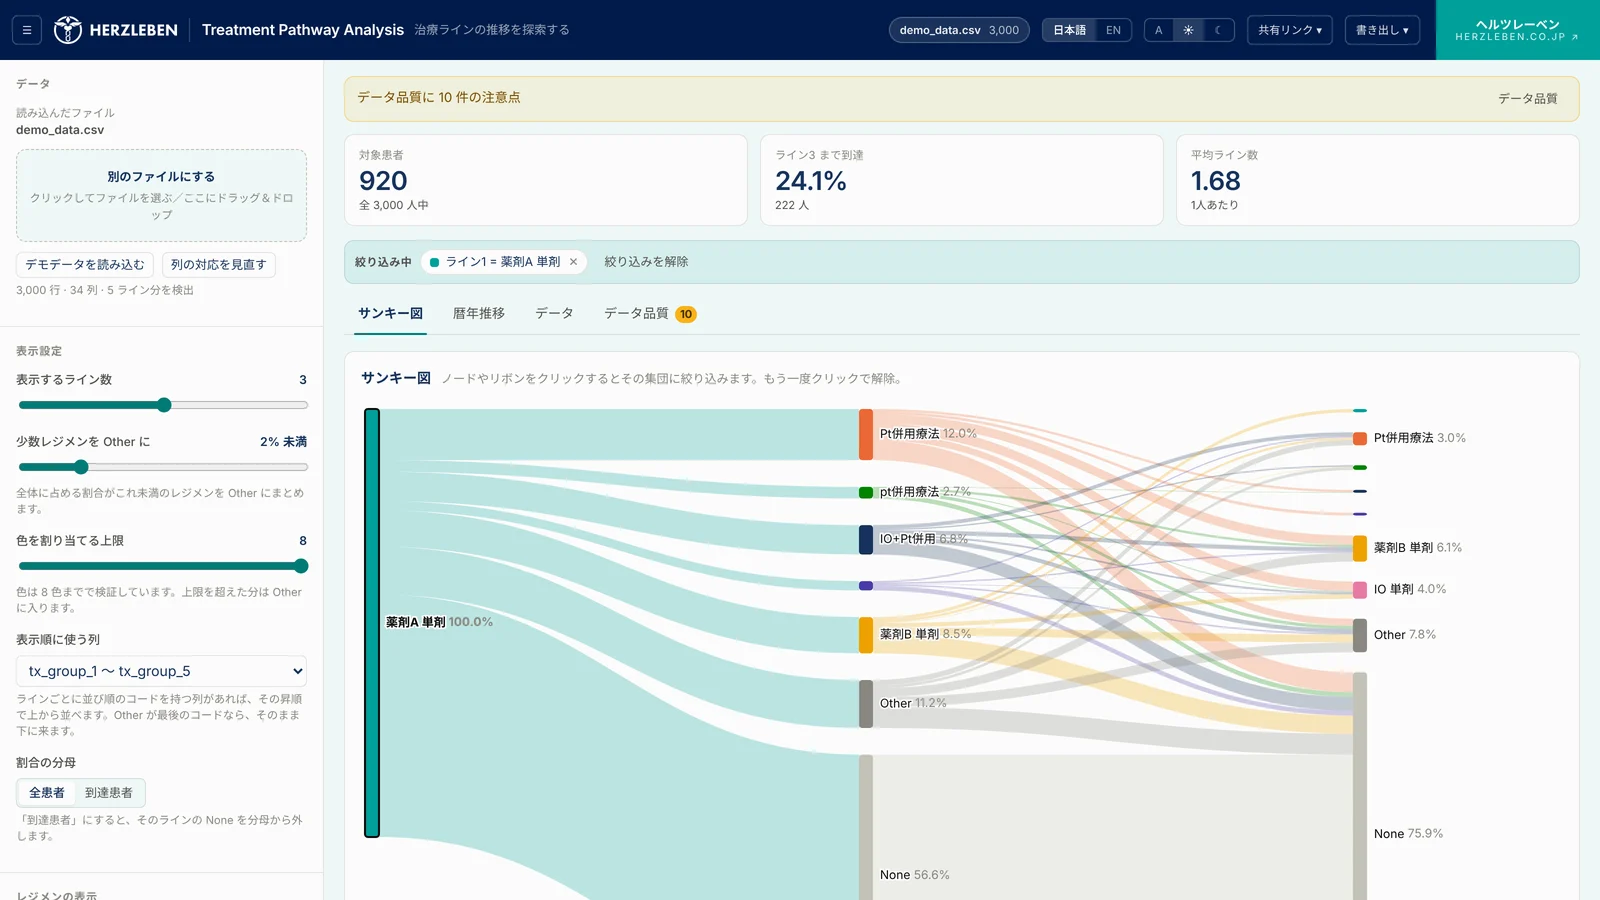
Analysis Listings × Treatment Pathways
Shows how patients move between lines of therapy as a Sankey diagram. Click a node to narrow the cohort, and check calendar trends and data quality on the same screen.
- Python
- FastAPI
- React

LIFE SCIENCE × HEALTHCARE × GENERATIVE AI
Beyond the proof of concept.
Work HerzLeben has delivered. For some of it, we have published how it was built.
A workflow that rebuilds the TrialMind paper's procedure with Claude Code: subagents handle PubMed search, abstract screening and full-text data extraction, and the results are checked with the paper's own metrics. The output can be explored in a sample report.
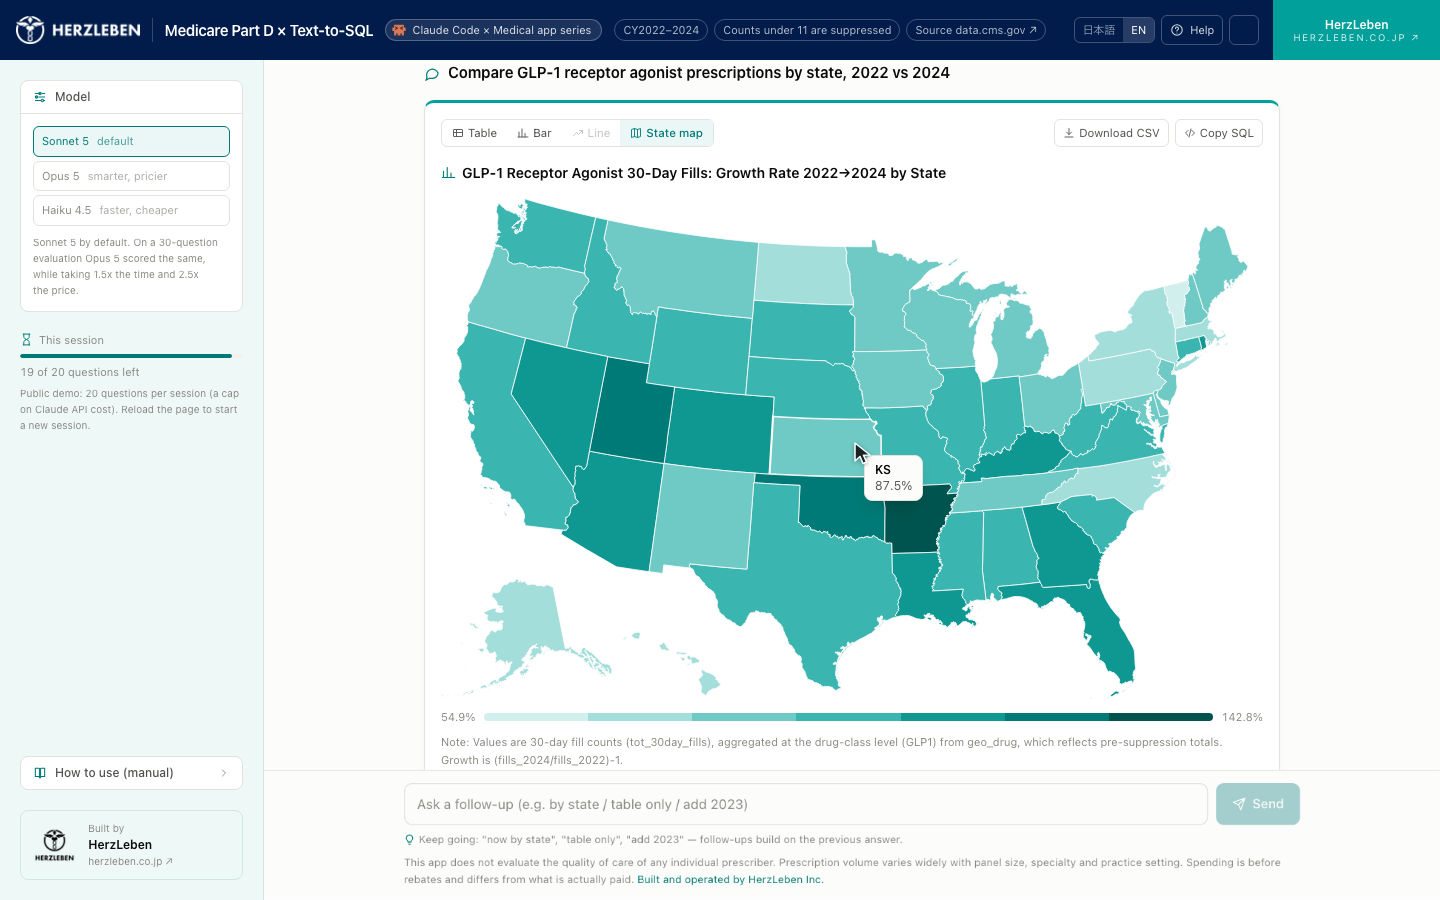
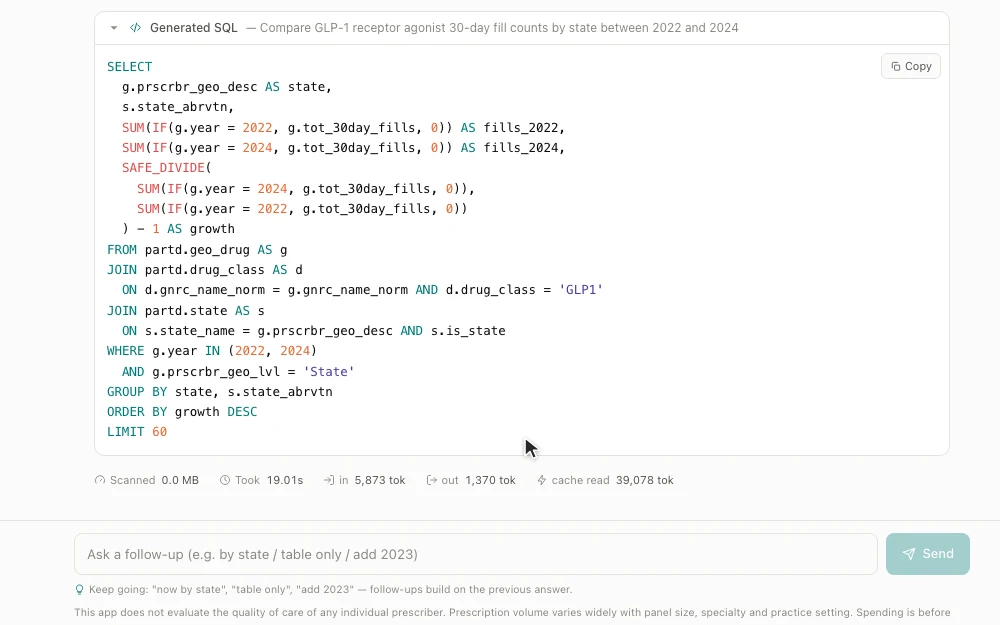
An app for exploring 80.7 million rows of US prescription data in plain language, without writing SQL. Ask a question and Claude writes and runs the SQL on BigQuery, then returns maps, charts and an interpretation.
Shows how patients move between lines of therapy as a Sankey diagram. Click a node to narrow the cohort, and check calendar trends and data quality on the same screen.
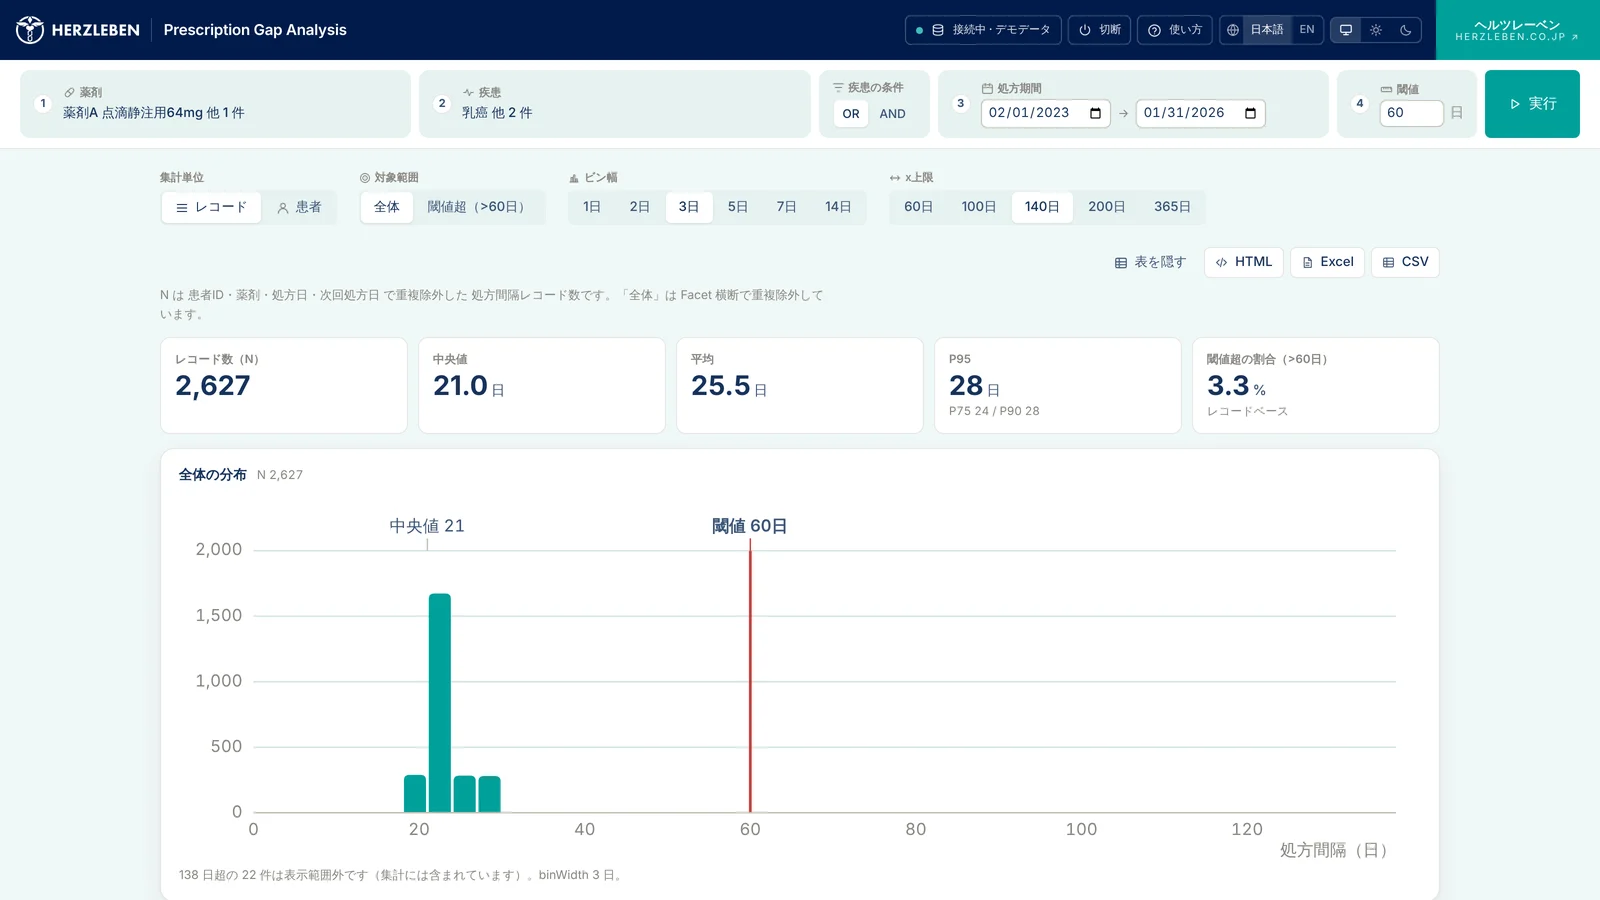
Calculates the days between consecutive prescriptions for each patient and shows the distribution by drug, disease and period, including the share of gaps over a threshold.
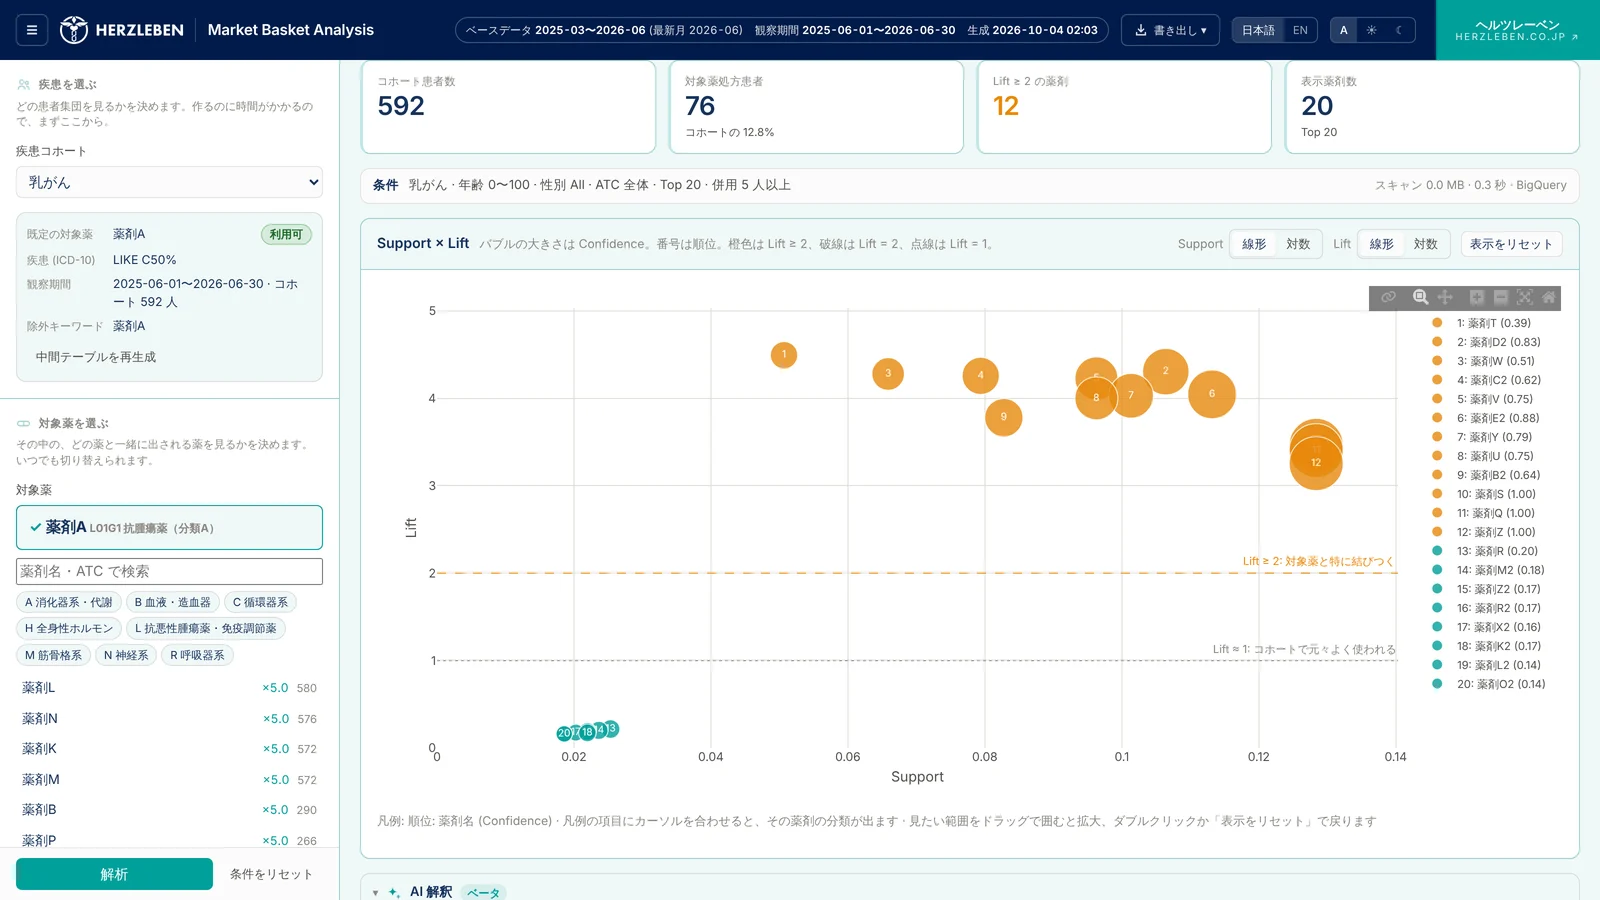
Pick a disease and a target drug to see which drugs were prescribed on the same day, scored by Support, Confidence and Lift. Teams can explore it themselves without writing SQL.
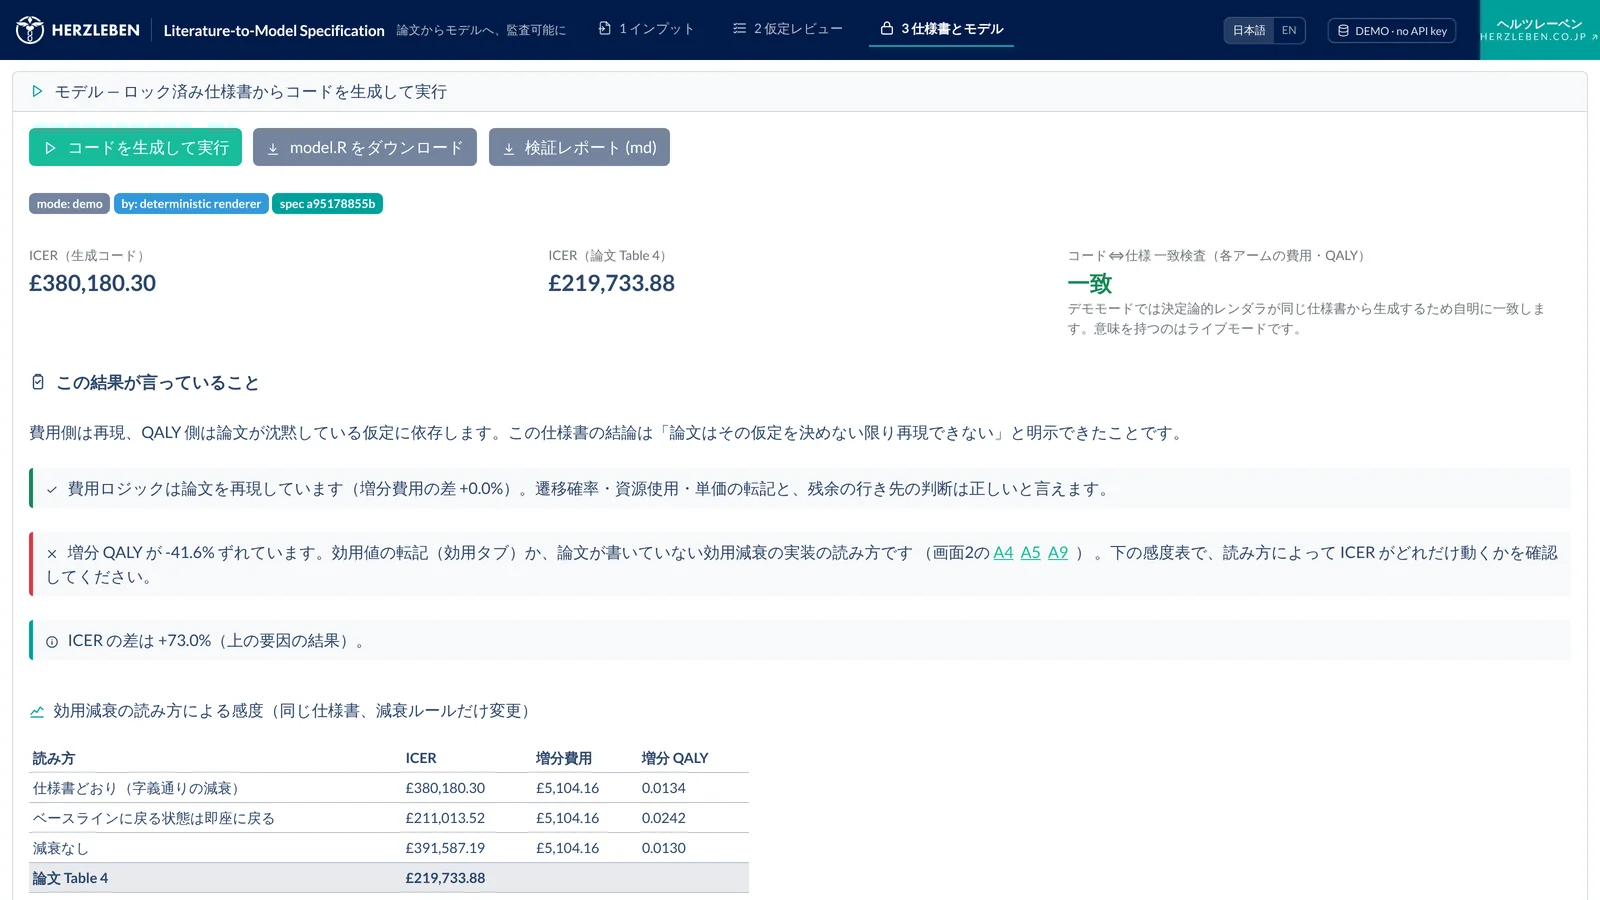
A reviewer approves the assumptions a paper leaves unstated, and an R model is generated from the locked specification alone. It then shows which assumption explains any gap from the published result.
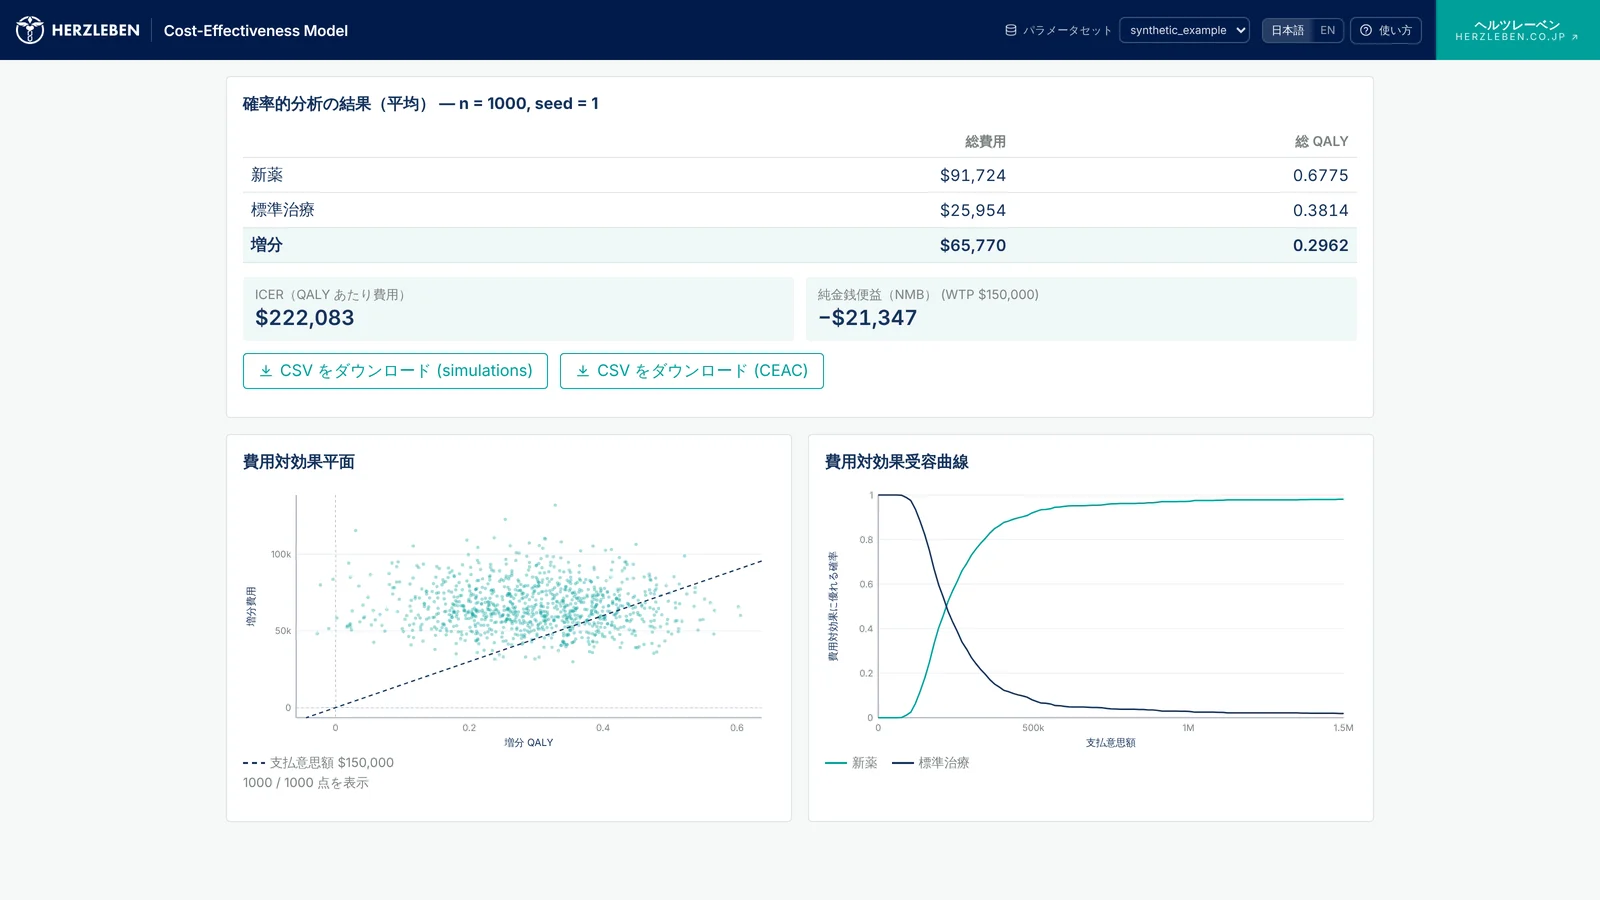
Runs a two-arm cost-effectiveness model in the browser. Switch survival distributions and review one-way, probabilistic and scenario analyses as tornado charts and acceptability curves.
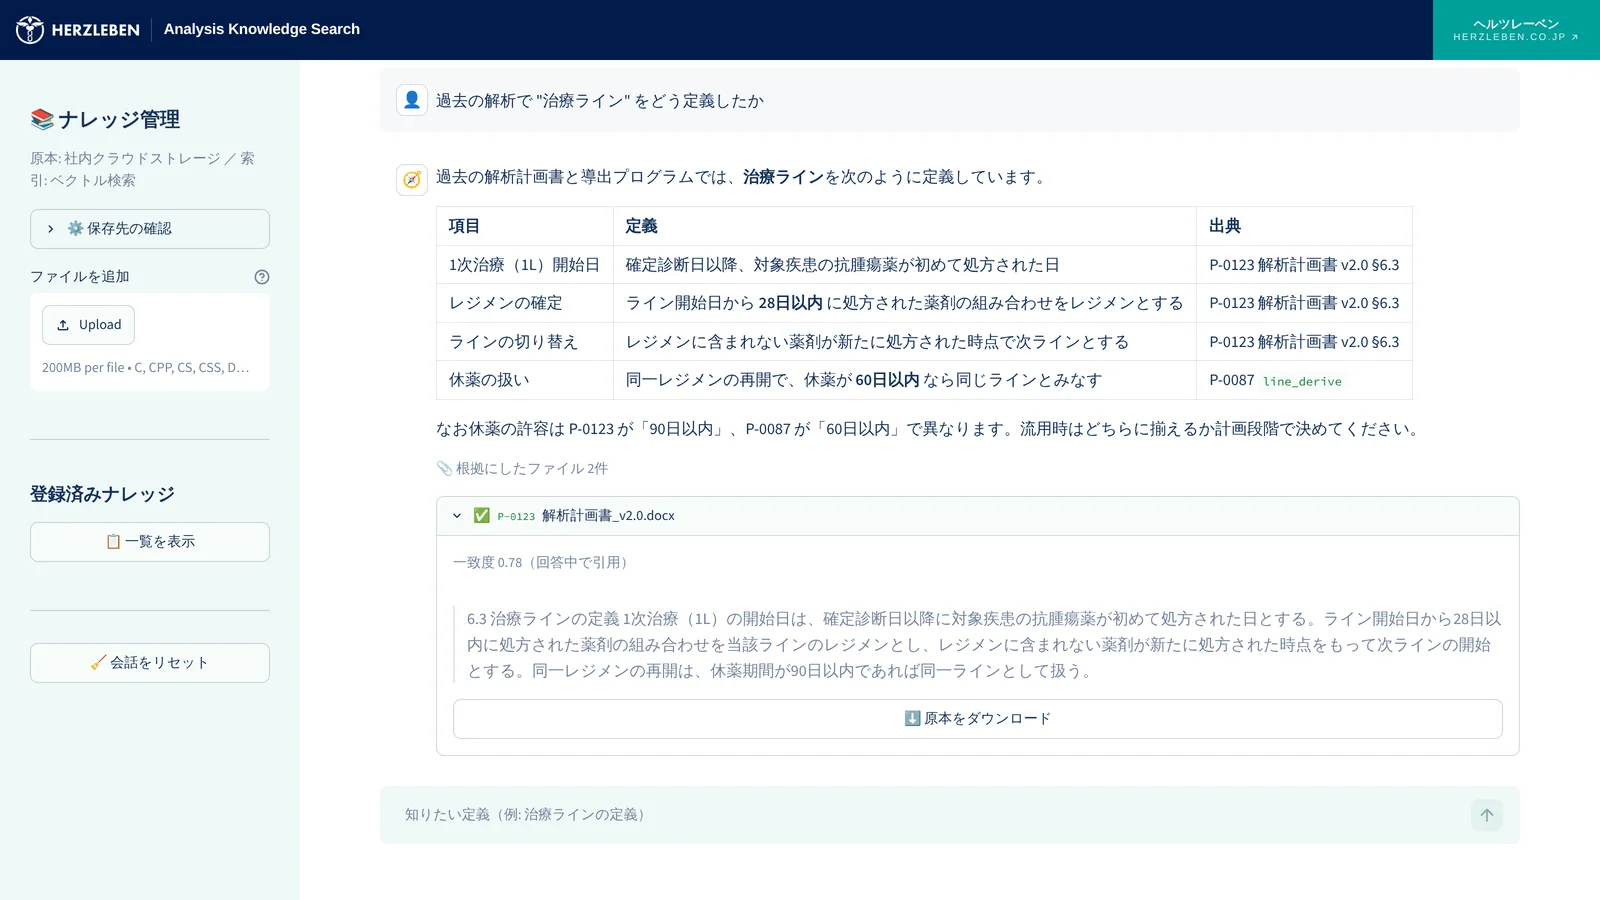
Search past analysis plans and programs by chat to find definitions and analysis logic. Each answer shows the source passage and original file, easing the load of internal questions.
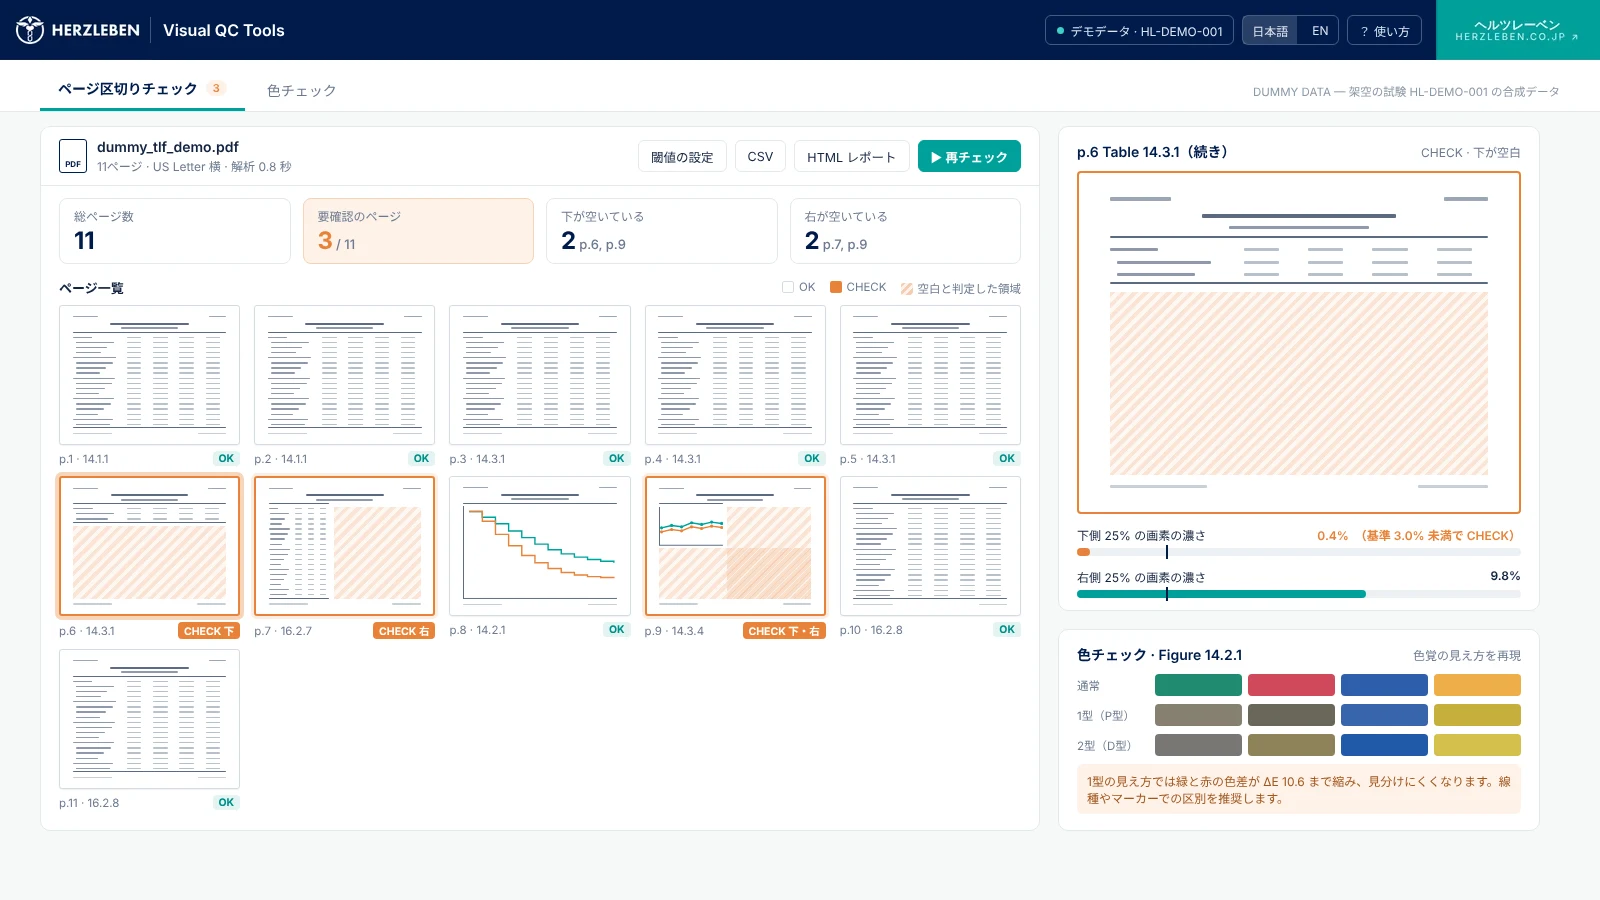
Reads TLF PDFs and flags pages with unusual blank space at the bottom or right, based on pixel density. The same screen also checks whether figure colours are hard to tell apart under different types of colour vision.
We take on projects that put data and generative AI to work, mainly in life sciences and healthcare.
We build the screens people use to work with medical data, from sorting out requirements to implementation. Not a one-off analysis report, but something the team touches every day.
We start from how it will be used — for example, clicking a chart to narrow the patient group and checking the distribution or trend on the spot.
We replace the aggregation, charting and slide-making that medical affairs and commercial teams repeat every month with a system that has generative AI built in. People only check whether the numbers hold up and how to read them.
From PoC design through to running it in production. Built around guardrails and human-in-the-loop, so output never flows through unchecked.
So that your team can keep growing the tools we deliver, we also hand over how they are built, through exercises on real data.
See TRAINING →The people who most often come to us are in roles like these.
HerzLeben draws on four settings: data analysis inside a pharmaceutical company, digital transformation for life-science clients at a consulting firm, product rollout at a medical device manufacturer, and clinical practice. From there, we build generative AI into the day-to-day work of life sciences and healthcare.
Depending on scale and domain, we team up with outside specialists — so one point of contact can carry a project from requirements through implementation to adoption.
Notes on how we build, and what we learn along the way.
We help life-science and healthcare teams put data and generative AI to work in practice.