
Claude Code × Medical Application
[Claude Code] Turning Visual Checks into Automated Checks, Part 1: Detecting Page Breaks — Measuring White Space by Greyscale Intensity
1. Introduction — a broken page shows up as white space
As we saw on the reference page, pages with broken page breaks share a common shape.
- Only one or two rows are left at the end of the page, with a large empty area below
- Columns are pushed onto the next page, leaving a large empty area on the right
- The page holds only a title and footnotes, with almost no content
The numbers are correct, so numeric checks do not catch these. People find them by paging through the PDF one page at a time. Put the other way round: if you measure how much white there is along the bottom and right edges of each page, you can narrow down the pages that need a human eye.
This post goes through that measurement step by step.
- Where the method comes from
- What we wrote before handing the work to Claude Code
- Turning the page into a greyscale image and measuring the white ratio
- Flagging pages — the threshold and the “near threshold” label
- Why page 1 is skipped, and the range to check
- What changes when you move the threshold
- What this method cannot find
- 31pagesthe dummy TLF used throughout the series (30 pages checked, pages 2–31)
- 8pagesflagged CHECK; the same 8 pages we deliberately broke
- 0.98threshold for the bottom edge and right edge white ratios
- ≈30mscomputation time per page (in the browser)
2. Where the method comes from
The method is based on the PharmaSUG 2026 paper “Detecting Abnormal Page Breaks Using Grayscale Pixel-Density Analysis in R Shiny” (Yi Guo, Paper AP-233). The same method was also presented at an R/Pharma 2026 workshop.
The idea in the paper is simple. Turn the page into a greyscale image and count the proportion of white pixels. A normal page packed with tables and text has a moderate white ratio; a broken page is almost pure white towards the edges. The method captures that difference as a number.
In TLF Visual QC, we reimplemented the method to run in the browser, following the steps and default values described in the paper. The reason is that the PDF is never sent to a server; everything is computed only on the user’s own computer (this design is covered in Part 4).
3. What we wrote before handing the work to Claude Code
3-1. The instructions
We left the implementation to Claude Code, but before starting, we wrote down in an instruction document what to build and what to protect. Its contents were as follows.
| Item | What we wrote |
|---|---|
| Purpose | Find pages with unnatural page breaks in a TLF PDF |
| Steps and defaults | Follow the paper’s steps. Use the paper’s defaults as they are for resolution, downscaling ratio, cropped bands, white cut-off and thresholds |
| What to protect | Never send the user’s PDF anywhere. Add no outbound communication (including analytics or advertising tags). Use no real drug names, study numbers or company names |
| How to verify | Build a dummy TLF with deliberately broken pages mixed in, and fix the correct page numbers in advance. It passes if the CHECK pages match the answer |
| Where to stop | Once page-break detection is implemented, write a report and stop. Colour checks and screen finishing come in the next stage |
3-2. What people decided
The most important point in the instructions was deciding that we would not tweak the steps or defaults ourselves.
Each value in the paper has a reason behind it. If you start adjusting things because “this might work better,” you can no longer compare against the paper’s results, and you lose track of what is actually having an effect. We set the order: confirm it works exactly as in the paper first, and only then make changes.
The other point was preparing the answer first. With a dummy TLF that records which pages were broken, pass or fail comes down to one question: “Are the 8 pages flagged CHECK the same 8 pages we broke?” This leaves no room to look at the results and then judge them “roughly right” (verification is covered in detail in Part 2).
4. Turning the page into a greyscale image and measuring the white ratio
There are six steps.
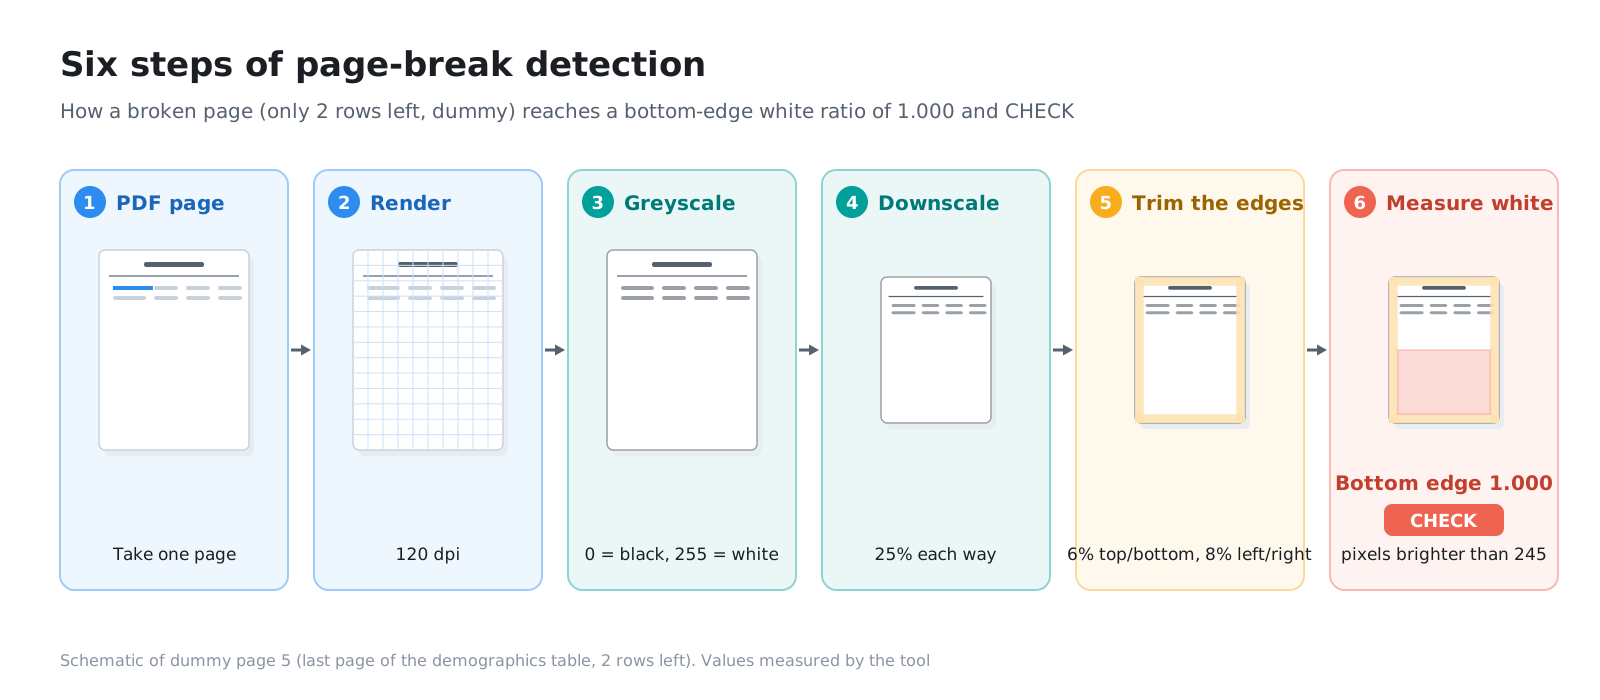
4-1. Render the page as an image (120 dpi)
Each PDF page is rendered as a 120 dpi image. In the browser, the PDF viewer component (PDF.js) draws the page, and the pixels are then read back.
4-2. Convert to greyscale
The colour image is converted to a greyscale image that holds brightness only. Pixel values run from 0 (black) to 255 (white).
4-3. Downscale (25%)
The image is shrunk to 25% in each direction. The shapes of small characters are lost, but all we want to know here is “where is it white,” so that does not matter. With one sixteenth of the pixels to compute, it runs faster.
4-4. Crop the edge bands (6% top and bottom, 8% left and right)
The top and bottom 6% and the left and right 8% of the page are cut away, and only the central area is examined.
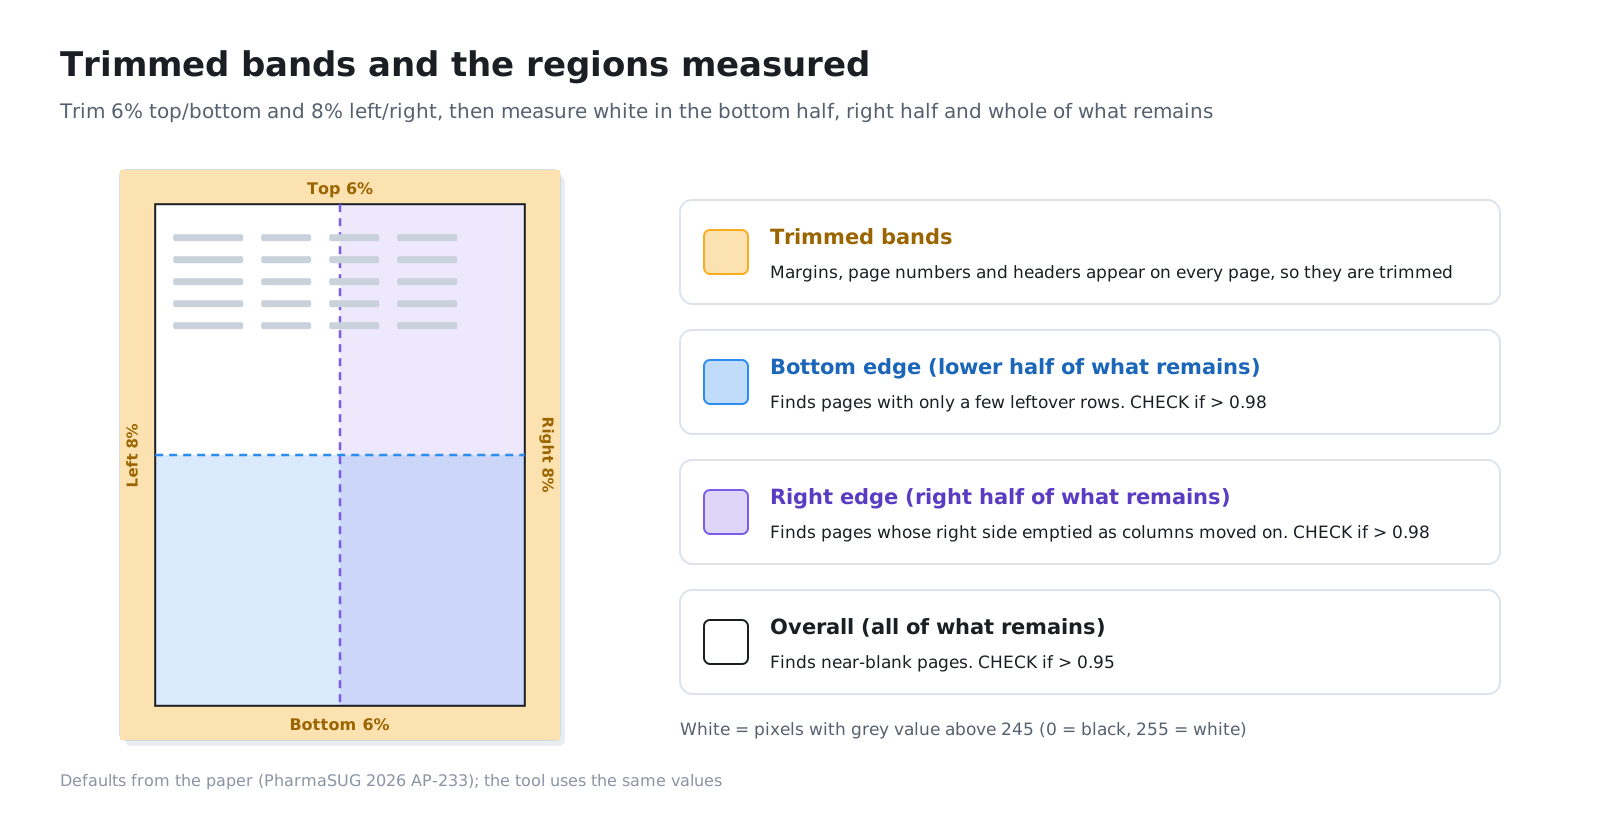
Paper margins, and the page numbers and headers that appear identically on every page, are present on all pages, so they do not help tell pages apart. Removing them first makes differences in what we actually care about, the layout of the content, show up more clearly in the numbers.
4-5. Count as white (pixels brighter than 245)
A pixel with a value greater than 245 is counted as “white.” This includes not only pure white (255) but also light greys close to the paper background. Table rules and light shading are not counted as white.
4-6. Three white ratios
For the remaining area, three white-pixel ratios are calculated.
| Metric | Area | Role |
|---|---|---|
| Bottom edge white ratio | Bottom half of the remaining area | Find pages with only a few rows left at the end (primary) |
| Right edge white ratio | Right half of the remaining area | Find pages where columns were pushed over, leaving the right empty (primary) |
| Overall white ratio | The whole remaining area | Find nearly blank pages (supporting) |
5. Flagging pages — the threshold and the “near threshold” label
5-1. The CHECK conditions
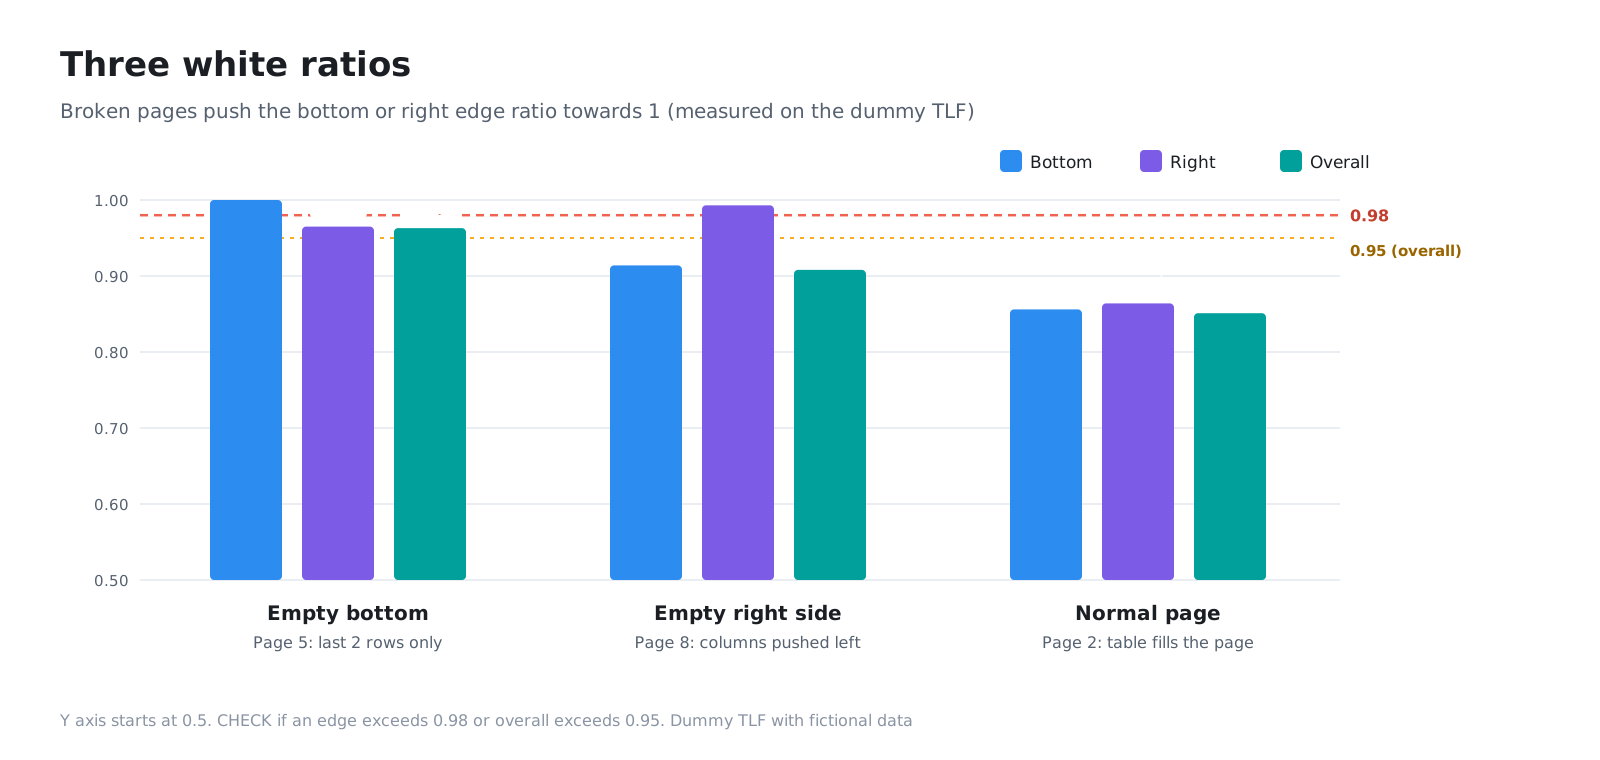
A page that meets any one of the following is flagged CHECK. All other pages are OK.
- The bottom edge white ratio is greater than 0.98
- The right edge white ratio is greater than 0.98
- The overall white ratio is greater than 0.95
If 98% or more of the bottom half is white, there is almost no text in the bottom half. On a normal table page, the table runs right down to the last row, so this does not happen.
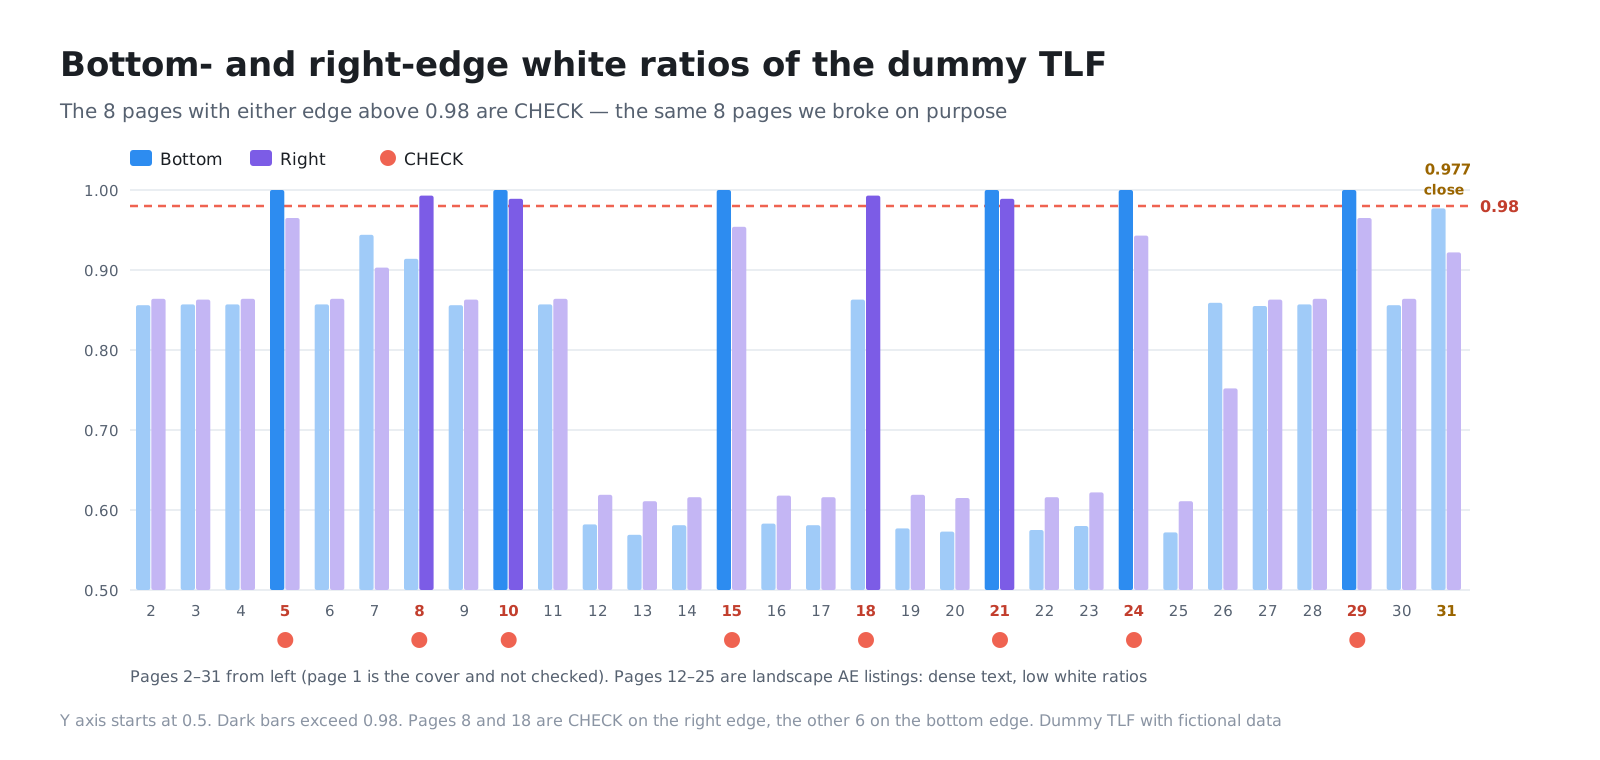
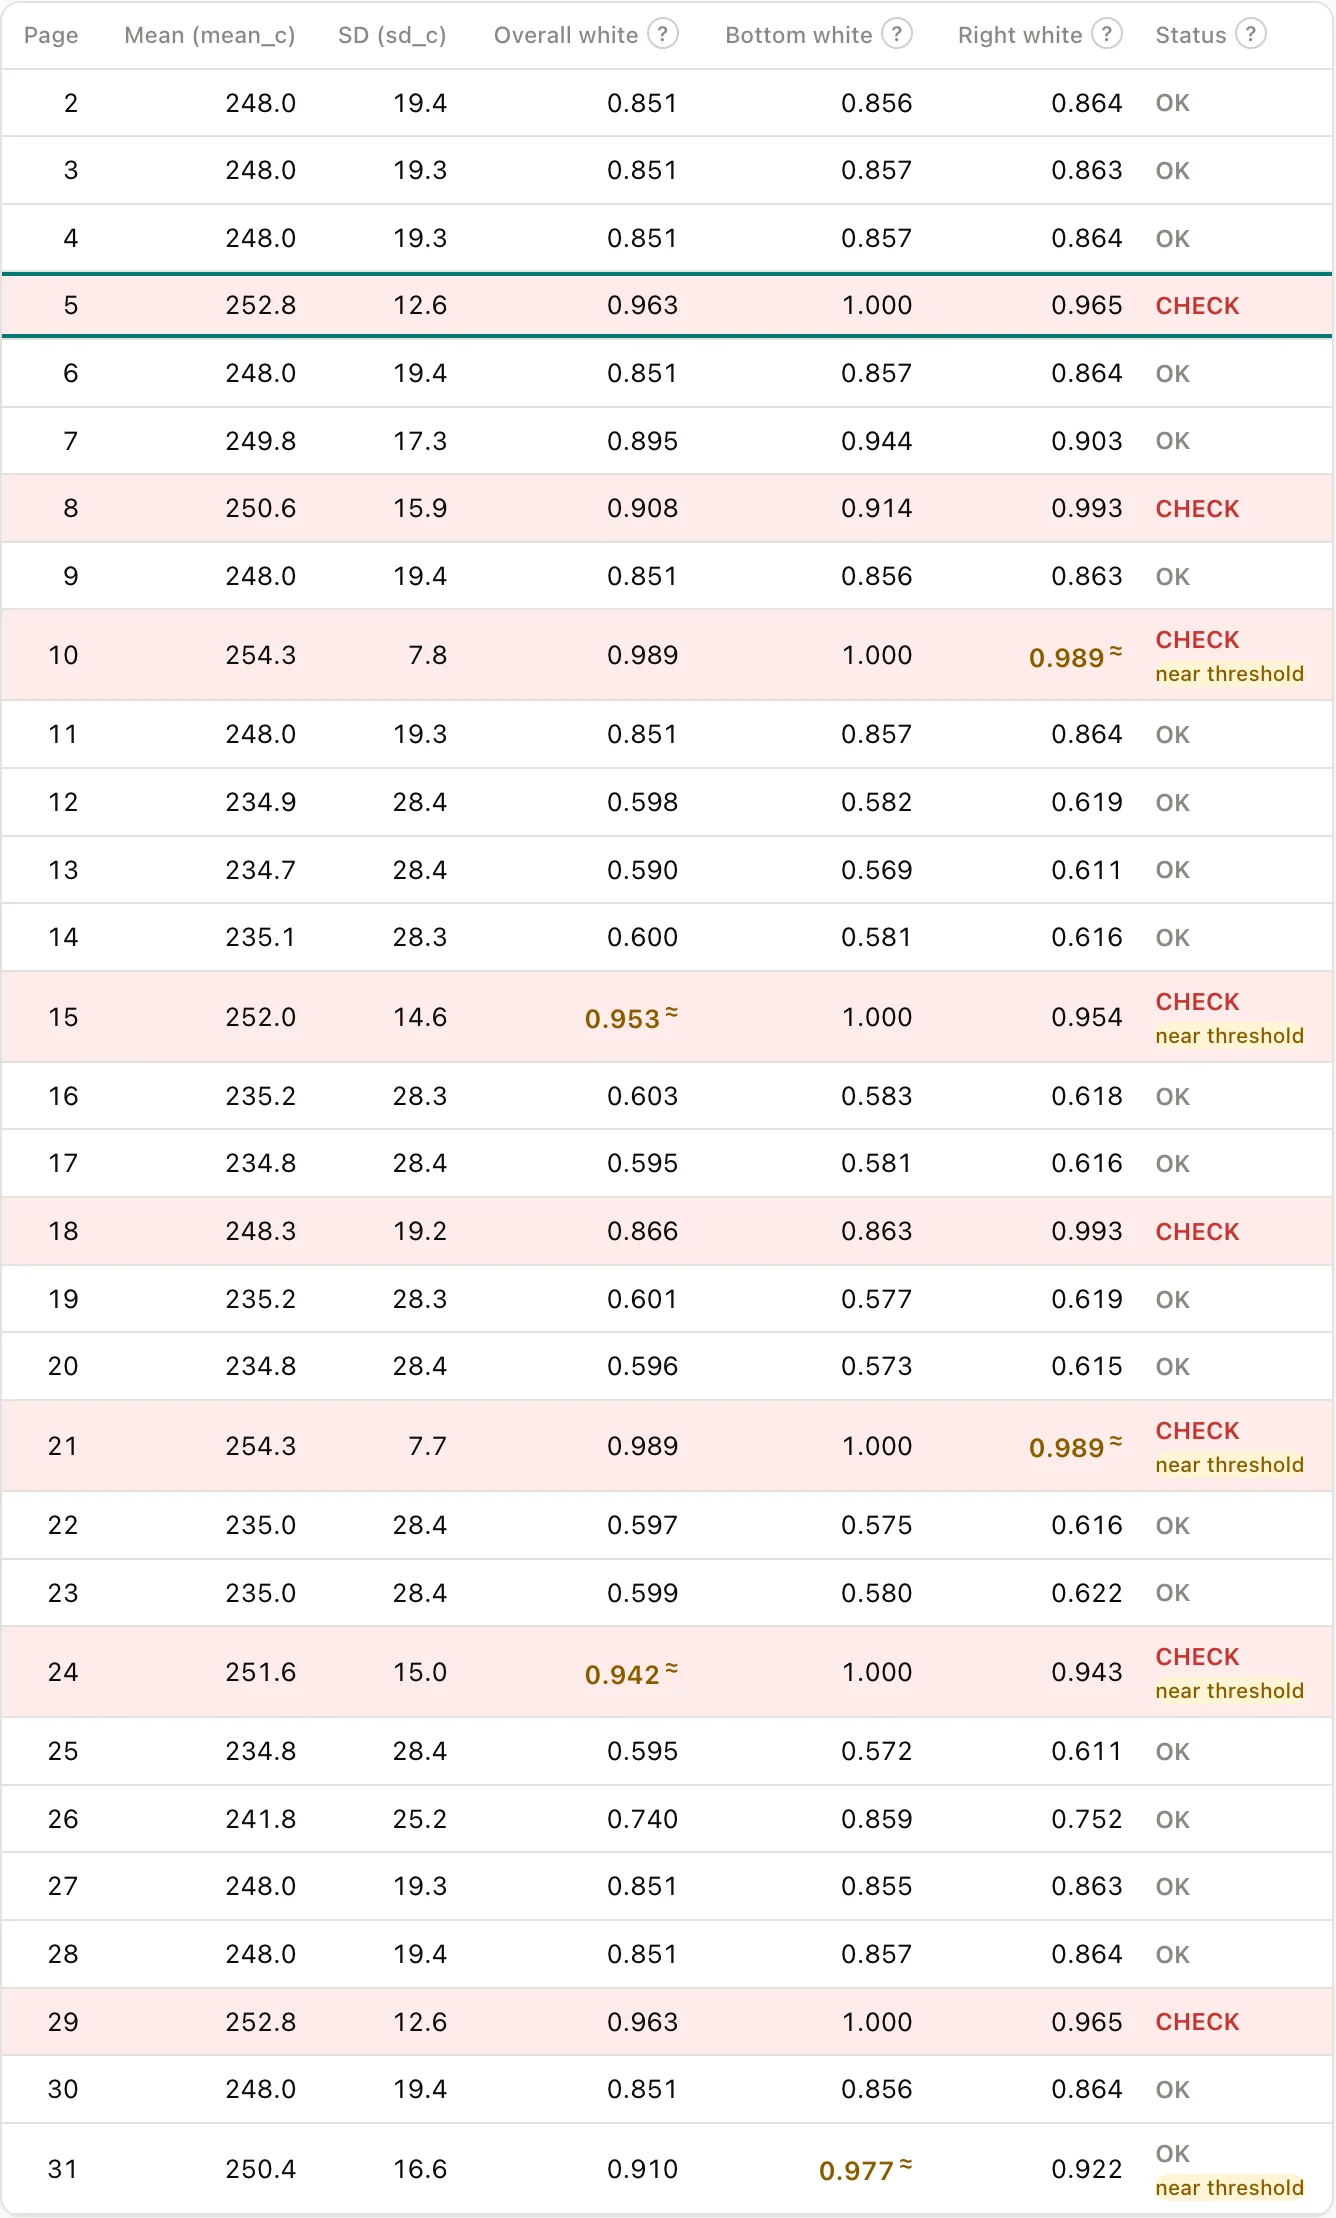
In the dummy TLF, 8 pages were flagged CHECK: 5, 8, 10, 15, 18, 21, 24 and 29. These are the same 8 pages we deliberately broke.
5-2. Mean and standard deviation are not used for the verdict
The paper also calculates the mean and standard deviation of the page’s pixels, but these are only displayed as reference values and are not used for the verdict. The mean and standard deviation capture changes in how white the page is as a whole, but they cannot tell where the white area is. Whether a page is broken depends on whether the white is concentrated towards an edge, so the verdict uses the three ratios, which carry position.
We also do not use robust measures such as the median. Almost all pixels on a page are close to white, so the median is nearly the same on every page and shows no difference.
5-3. The “near threshold” label
If you draw the line exactly at the threshold, 0.979 and 0.981 get different verdicts. So in TLF Visual QC we decided to add a discreet “near threshold” label to pages whose white ratio is within ±0.01 of the threshold. This is a display added in the tool; it is not in the paper. It does not change the verdict itself.
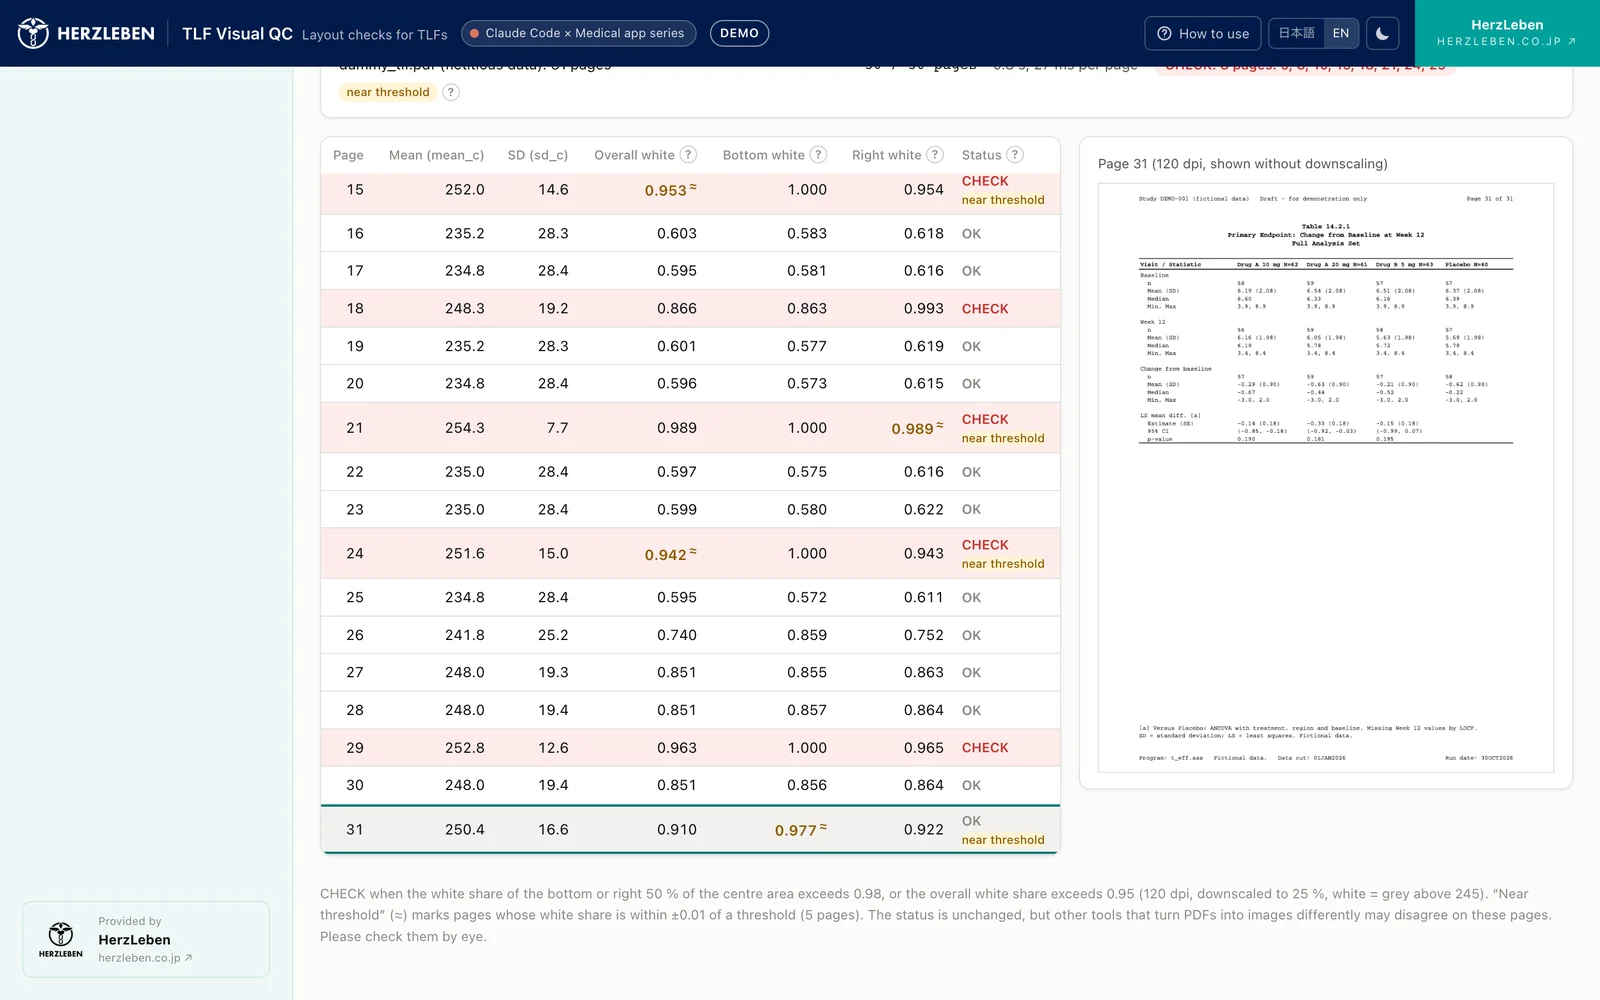
In the dummy TLF, the label appears on 4 pages, 10, 15, 21 and 24 (all CHECK), and on page 31 (OK). Page 31 is a short table followed by two lines of footnotes, with a bottom edge white ratio of 0.977. It is not flagged CHECK, but it is picked up as a page you may want to check by eye just in case, even though it is OK.
6. Why page 1 is skipped, and the range to check
In the paper, checking starts from page 2. Page 1 is a cover or table of contents, centred on a logo and title, and has a different shape from the body of the TLF. Breaks on page 1 are rare, and if one does occur, an ordinary review spots it at once.
TLF Visual QC also starts from page 2 by default. Some PDFs have no cover, however (the table starts right on page 1), so we made the range to check configurable.

7. What changes when you move the threshold
The value 0.98 is the paper’s default, and it is not necessarily optimal for every TLF. Lowering the threshold adds flags; raising it removes them.
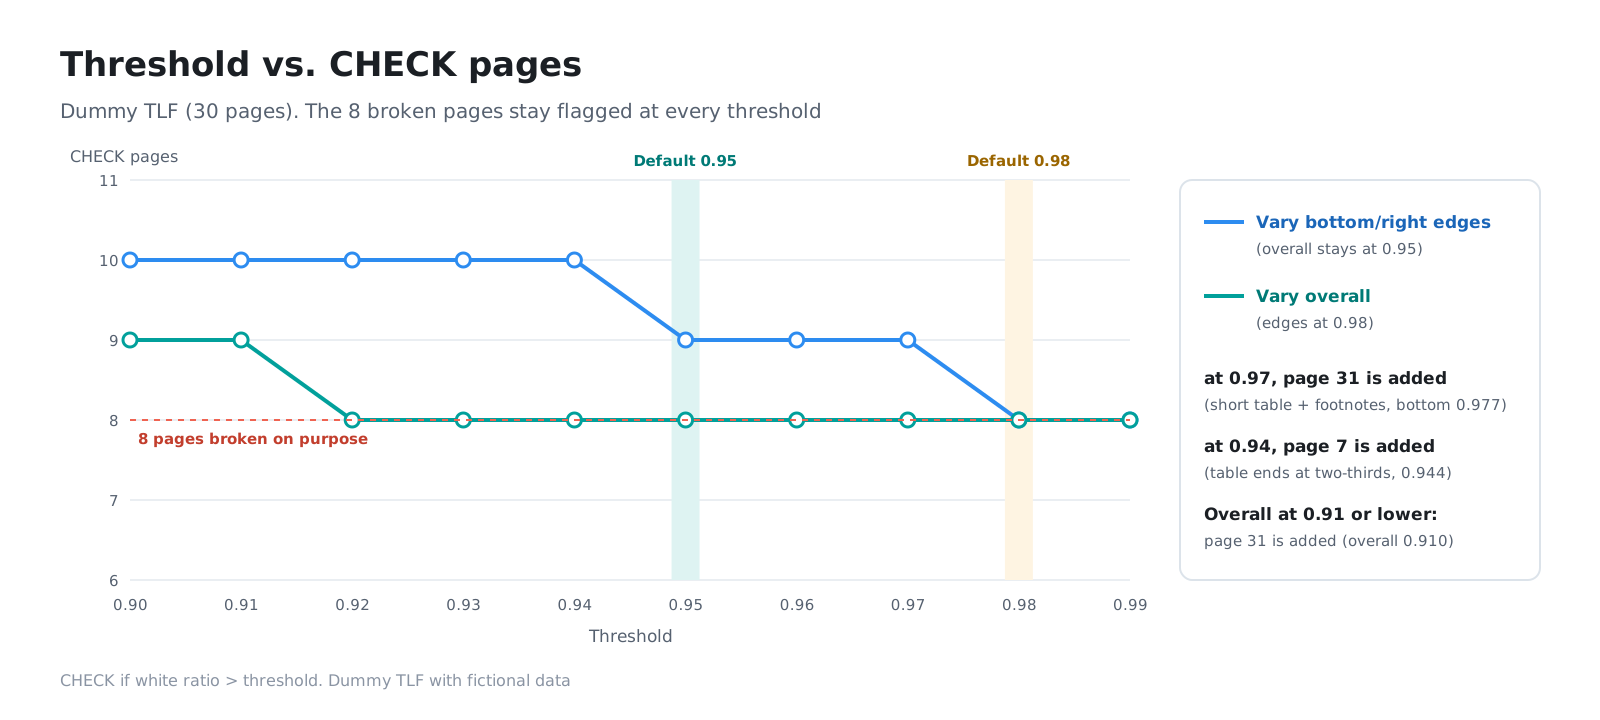
In the dummy TLF, the 8 deliberately broken pages have bottom edge or right edge white ratios close to 1.000, so even raising the threshold to 0.99 left them at 8 pages. Lowering it adds page 31 (the short table with footnotes) at 0.97 and page 7 (a normal page whose table ends two thirds of the way down) at 0.94, for 10 pages. Lowering the overall threshold (0.95) to 0.91 or below also adds page 31.
Set the threshold too low and normal pages get flagged too, adding to the pages you must check by eye. Set it too high and you miss pages with smaller breaks. The right value depends on the company and on how its TLFs are produced. The paper itself notes that the thresholds are fixed rules and need adjusting to each company’s layout.
8. What this method cannot find
Because this method measures “white space concentrated towards an edge,” it does not help in the following cases.
| Case | What happens |
|---|---|
| Tables that are short by design | A summary table that ends after a few rows has a white bottom even when nothing is broken, so it is flagged CHECK |
| Footnotes or footers in the bottom half | If footnotes or footers sit above the cropped band (the bottom 6%), within the bottom half of the measured area, their text lowers the white ratio. Even with a large empty area below the table, the page may fall short of 0.98 and stay OK |
| Breaks that are not white space | A table header not repeated on the next page, or a row cut off midway, does not show up as white space |
A flag on a short table can be dismissed as “not a break” in a few seconds by eye. Misses caused by footnotes or footers, on the other hand, produce no flag and are therefore harder to notice, so take care with TLFs that have many footnotes. The tool’s About section also carries this caution. Part 2 shows how this kind of miss appeared in a real submission-format TLF.
9. Summary
- A broken page break shows up as unnatural white space along the bottom or right edge of a page
- Render each page as a 120 dpi image, convert to greyscale, downscale to 25%, crop 6% at top and bottom and 8% at left and right, then measure the ratio of white (pixels brighter than 245) in the bottom half, the right half and overall
- Flag CHECK if the bottom or right exceeds 0.98, or overall exceeds 0.95. The tool also adds a “near threshold” label within ±0.01 of the threshold
- We decided in advance to follow the paper’s steps and defaults, and to verify with an answer-keyed dummy before changing anything
- Short tables get flagged, and footnotes or footers in the bottom half can cause misses. Use it to narrow down visual checks, not to replace them
Finding broken pages is less tiring with numbers than with your eyes. But knowing what the numbers actually measure is the surest way to avoid misses.
Next steps
Part 2 covers how we verified that this computation works correctly: comparing the image processing pixel by pixel against another tool, how we built the deliberately broken dummy TLF and its answer key, and the results of trying it on a submission-format TLF published by the R Consortium.
Sources
- Yi Guo. Detecting Abnormal Page Breaks Using Grayscale Pixel-Density Analysis in R Shiny. PharmaSUG 2026, Paper AP-233. https://pharmasug.org/proceedings/2026/AP/PharmaSUG-2026-AP-233.pdf (the method was also presented at an R/Pharma 2026 workshop)
- The TLF images and figures on this page come from a dummy TLF (31 pages) built from fictitious data. It is not related to any real study, drug or company