
Claude Code × Medical Application
[Claude Code] Turning Visual Checks into Automated Checks, Part 3: Checking Colours — Greyscale, Colour Difference and Colour Vision
1. Introduction — different colours are not always distinguishable
Survival curves, line plots over time, bar charts by group: TLF figures often tell groups apart by colour. On screen, every colour looks clearly different. Even so, they become hard to tell apart in the following situations.
- When printed in black and white: a reviewer reads on paper, or a journal prints in black and white
- When viewed by people with a colour vision deficiency: in Japan, about 5% of men and about 0.2% of women
- When pale colours sit on a white background: they disappear on a projector or in a faint print
As we saw on the reference page, the US FDA’s PDF specifications also note that light colours do not print well on greyscale printers, and ask sponsors to check with a test print before submission.
This post looks at what the “Figure colours” tab of TLF Visual QC measures for the colours assigned to groups, and where it draws the line for a flag.
- Four measures — luminance difference, colour difference, colour vision and contrast with white
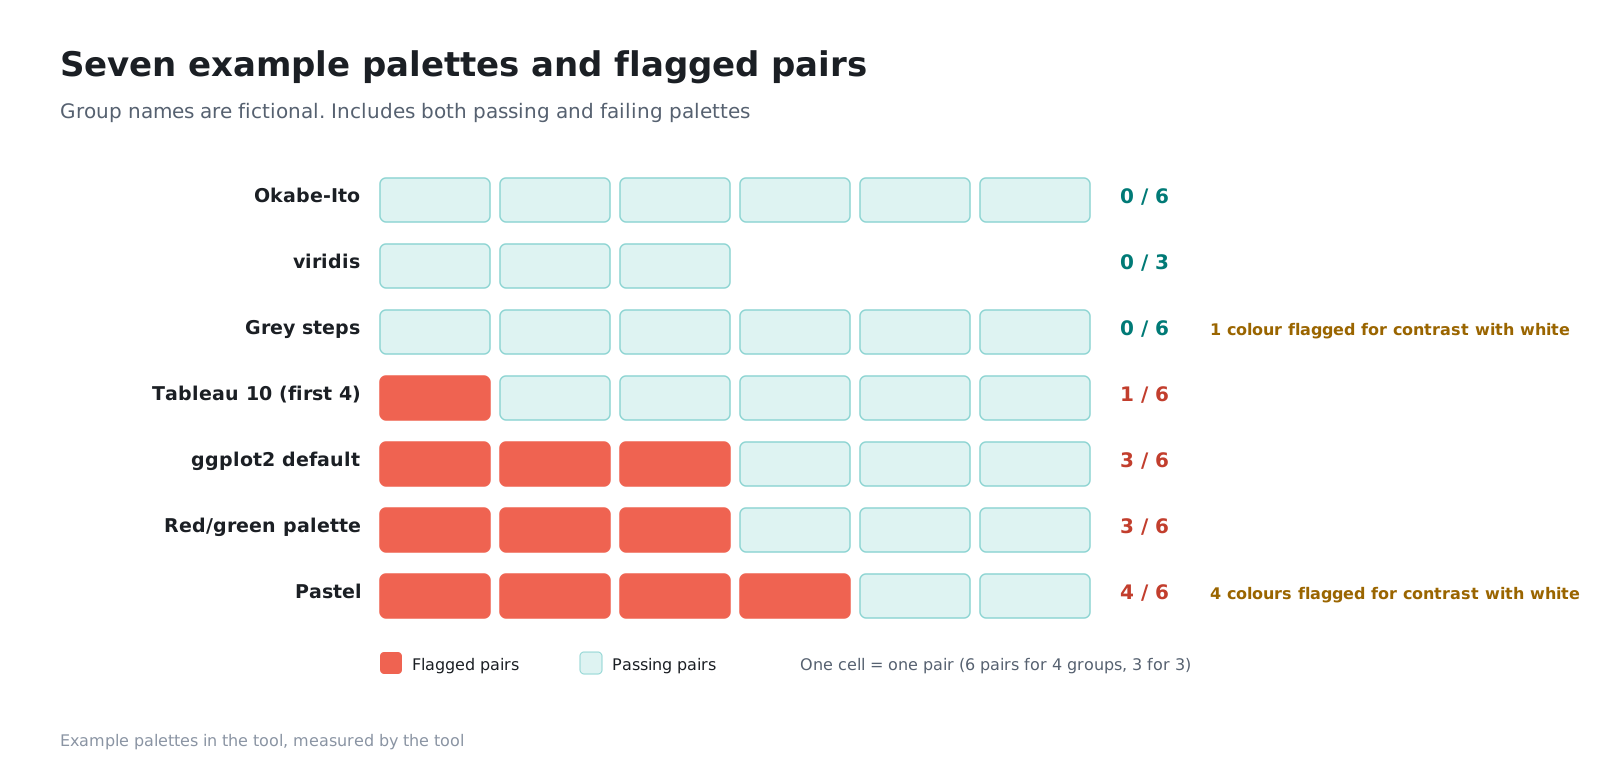
- Results for seven example palettes
- The colour vision simulation methods we used, and why we chose them
- Suggesting replacement colours (experimental)
- What we handed to Claude Code, and what people decided
- 7palettesexample palettes bundled with the tool (group names are fictitious)
- 0.002luminance difference in greyscale for a pair in ggplot2’s default palette (even though the colour difference is 34)
- 4.9colour difference between red and green as seen with deutan colour vision (71.8 with typical colour vision)
- 2palettes with no flags at all (Okabe-Ito and viridis)
2. Four measures
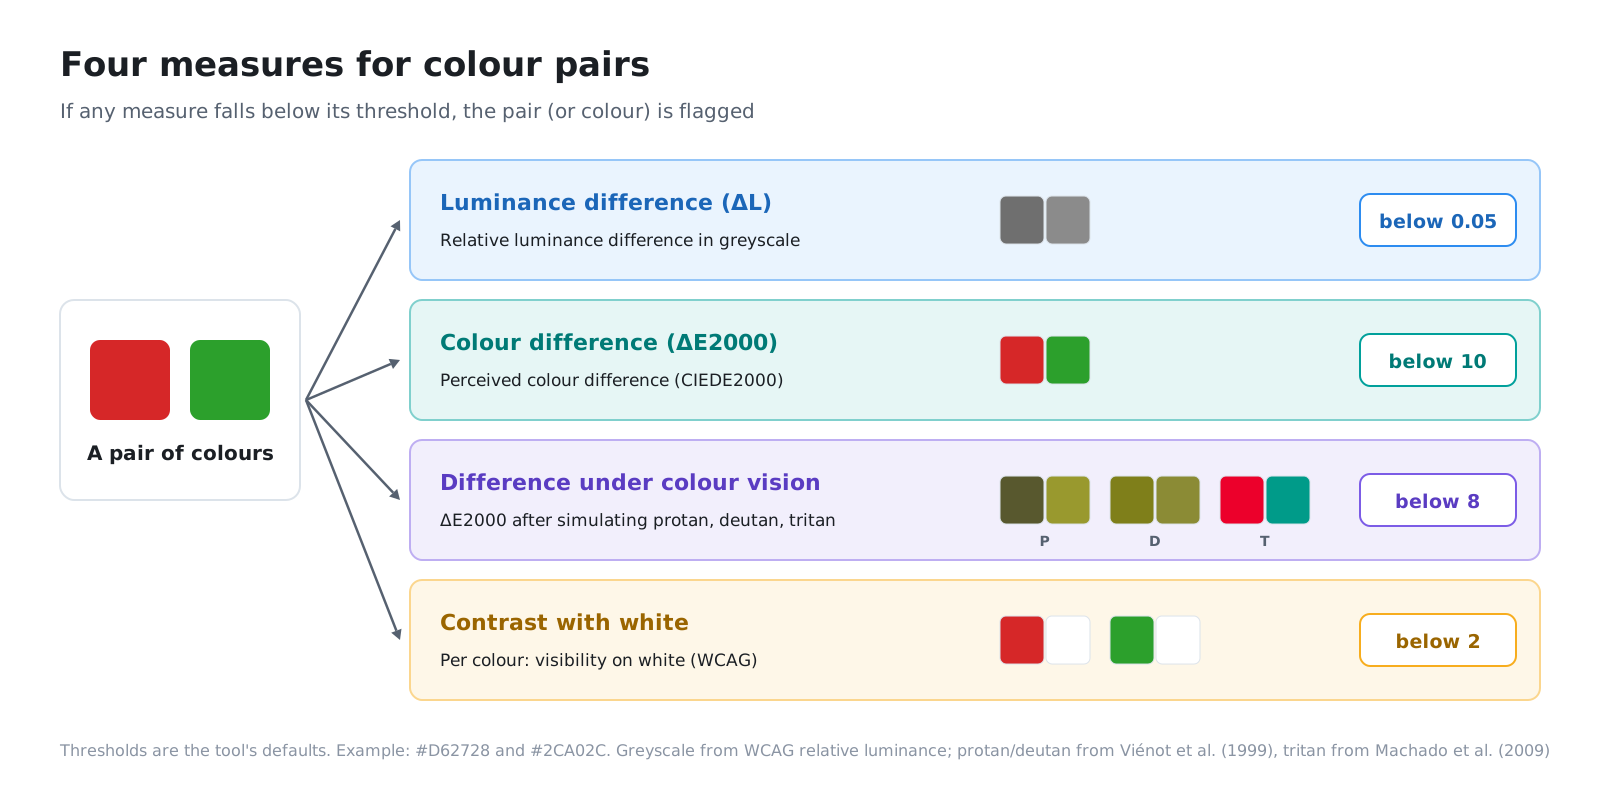
For each pair of colours, the tool calculates the following four measures. If any one of them falls below its threshold, the pair is flagged.
| Measure | What it measures | Flag threshold (default) |
|---|---|---|
| Luminance difference (ΔL) | Difference in brightness when the two colours are turned grey | Below 0.05 |
| Colour difference (ΔE2000) | How different the colours look to the human eye | Below 10 |
| Colour difference under colour vision types | Colour difference after converting to protan, deutan and tritan vision | Below 8 |
| Contrast with white | How well the colour stands out on a white background | Below 2 (per colour) |
The thresholds are the tool’s defaults. They are not absolute standards; adjust them to fit your company’s conventions for figures.
2-1. Luminance difference (ΔL) — printing in black and white
The brightness of a colour once turned grey is measured as relative luminance, as used in the web accessibility guidelines (WCAG). It runs from 0 (black) to 1 (white) and adds up red, green and blue with weights that match how the human eye perceives them. The eye sees green as bright and blue as dark, so a red and a blue of the same “strength” differ in brightness.
If the relative luminance of two colours differs by less than 0.05, they print as similar greys in black and white and become hard to distinguish.
2-2. Colour difference (ΔE2000) — the difference the eye perceives
There are several ways to put a number on colour difference. Here we use CIEDE2000 (ΔE2000), defined by the International Commission on Illumination (CIE). It moves colours into a colour space close to human perception (CIELAB), then combines the differences in lightness, chroma and hue, correcting for the quirks of how each is perceived. This comes closer to how “different” people find two colours than simply taking the difference in RGB values.
Pairs with a ΔE2000 below 10 are flagged as looking similar even in colour. The formula is long and easy to get wrong, for example in how hue angles are handled, so Sharma and colleagues published implementation notes and test data for 34 pairs. We confirmed that the tool’s implementation matches the expected answers to four decimal places for all 34 pairs. We also confirmed that swapping the order of the two colours gives the same value.
2-3. Colour difference under colour vision types — protan, deutan and tritan
The tool converts the colours to how they appear to people with a colour vision deficiency (a simulation), then measures ΔE2000 again.
| Type | How colours appear | Prevalence |
|---|---|---|
| Protan (type 1) | Red looks darker; red and green are hard to tell apart | Common |
| Deutan (type 2) | Red and green are hard to tell apart | Most common |
| Tritan (type 3) | Blue and yellow are hard to tell apart | Rare |
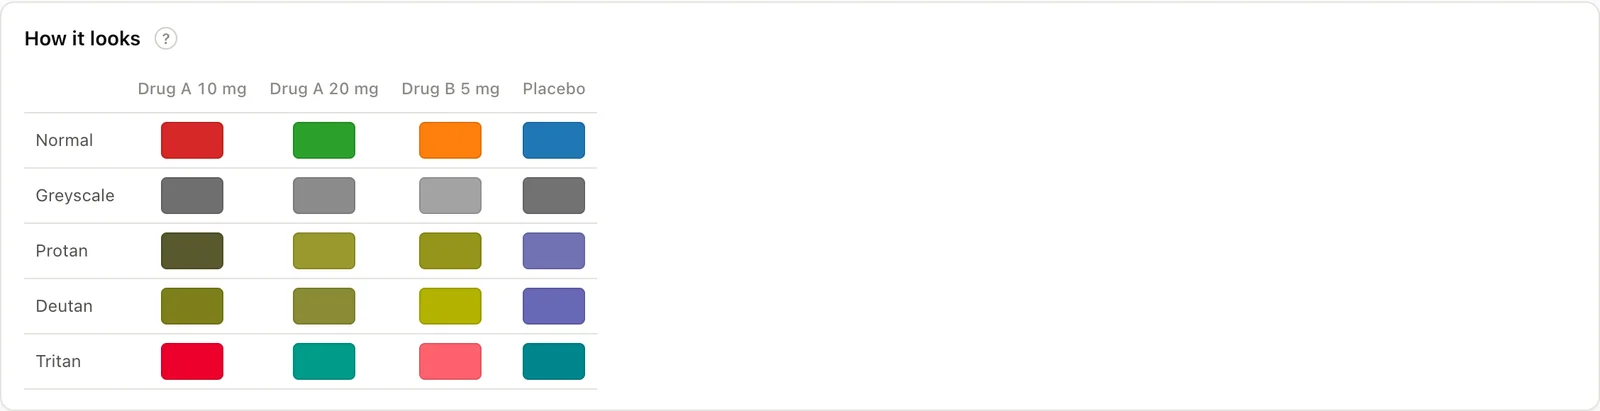
Pairs whose ΔE2000 after conversion is below 8 are flagged. On the tool’s screen, the protan, deutan and tritan views appear as rows in a single table, so you can see at once which type makes a pair hard to distinguish.
2-4. Contrast with white — pale colours
The last measure applies to each colour on its own rather than to pairs. It measures how well a colour stands out on a white background, using the WCAG contrast ratio. The tool flags colours below 2:1. For reference, WCAG asks for at least 3:1 for non-text elements such as graph lines and shapes. The tool’s threshold is looser, so for figures published on the web and similar uses, it is worth checking against the WCAG value as well.
3. Results for seven example palettes
The tool comes with seven example palettes with fictitious group names. They include palettes that pass and palettes that get flagged.
| Palette | Groups | Flagged pairs | Main reason |
|---|---|---|---|
| Okabe-Ito | 4 | 0 / 6 | — |
| viridis | 3 | 0 / 3 | — |
| Grey steps | 4 | 0 / 6 | All pairs pass. Only the palest grey (#BFBFBF) has a contrast with white of 1.84 |
| First four colours of Tableau 10 | 4 | 1 / 6 | Luminance difference (orange and teal, 0.025) |
| ggplot2 default | 4 | 3 / 6 | Luminance difference (all three pairs below 0.008) |
| Palette with red and green | 4 | 3 / 6 | Colour vision (red and green: deutan 4.9; green and orange: protan 1.9), luminance difference (red and blue, 0.009) |
| Pastel | 4 | 4 / 6 | Colour vision and luminance difference. All four colours have a contrast with white below 2 (1.29–1.72) |
3-1. A large colour difference, yet the same grey
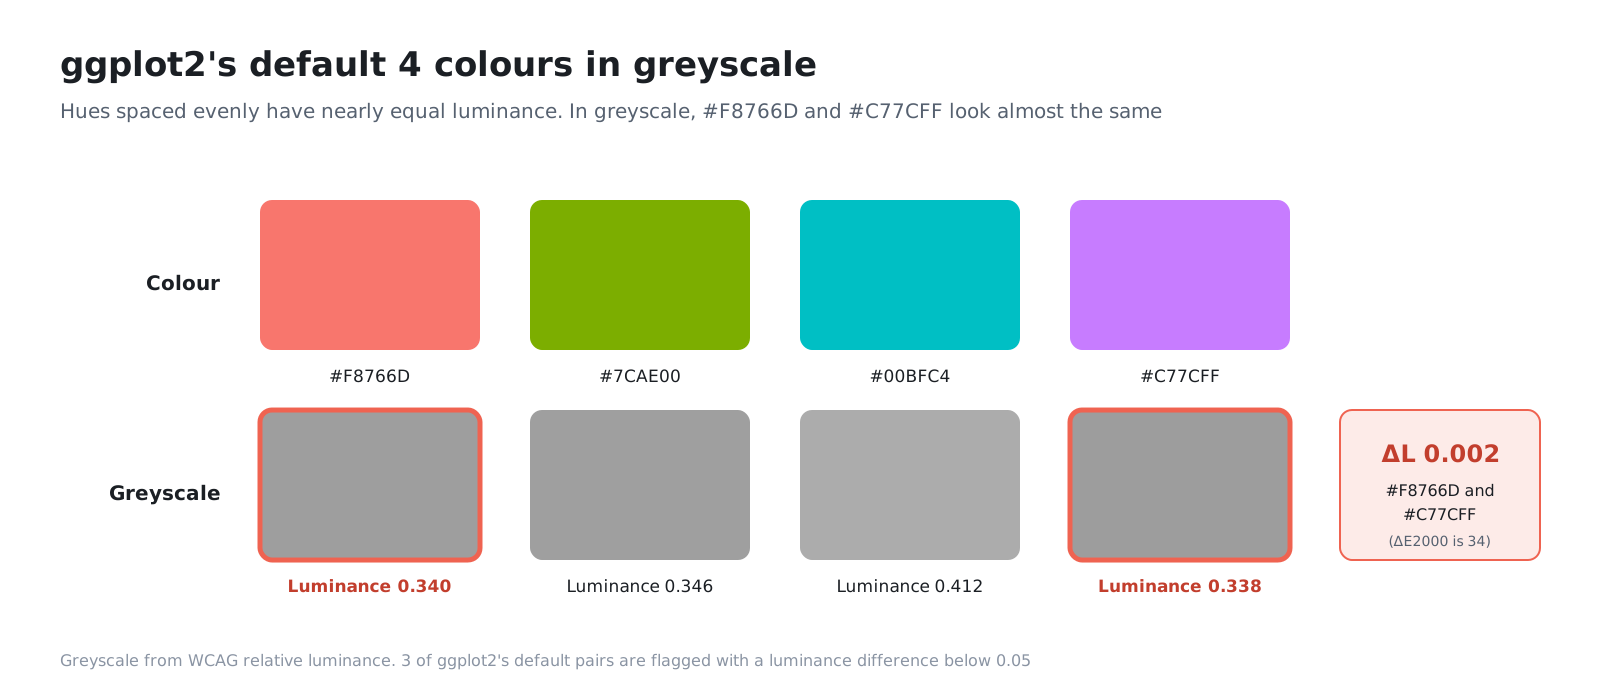
The clearest case is ggplot2’s four default colours. They are chosen by stepping evenly around the hue circle, so on screen any two of them look clearly different. The ΔE2000 between #F8766D (reddish) and #C77CFF (purple) is 34.
Yet both have a relative luminance of about 0.34, a difference of only 0.002. A palette that varies only hue while keeping brightness level prints as almost the same grey in black and white.
3-2. Red and green break down under colour vision deficiency
With typical colour vision, red (#D62728) and green (#2CA02C) have a ΔE2000 of 71.8: completely different colours. Converted to deutan vision, the difference shrinks to 4.9, and they become hard to tell apart. In the same palette, green and orange come out at 1.9 under protan vision.
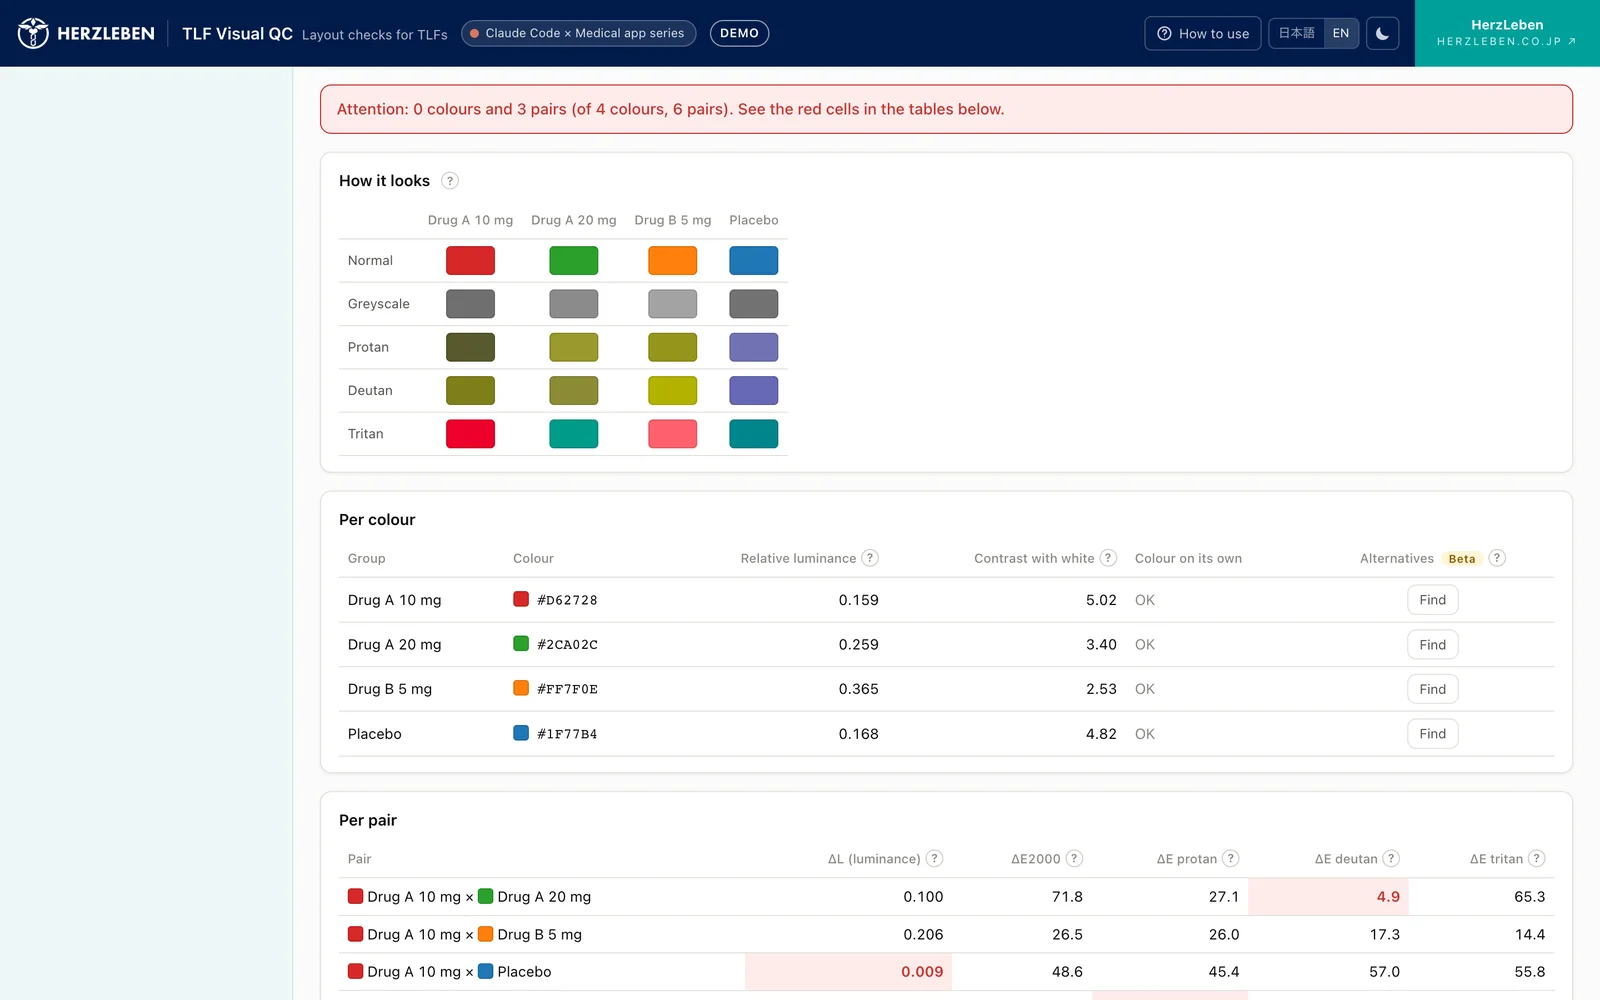
On the other hand, this red and green differ in luminance by 0.10 when turned grey, so they can be told apart in a black-and-white print. Some pairs are fine in black and white but break down under colour vision deficiency, and others the reverse, so you cannot rely on a single measure.
3-3. Palettes with no flags
Okabe-Ito is a palette chosen to be easy to distinguish for people with colour vision deficiencies too, and none of its six pairs were flagged. viridis is designed so that brightness changes in one direction from end to end, so its order is preserved even in greyscale, and all three pairs pass.
The grey steps palette passes for every pair, but the palest grey looks faint on a white background. This is why the measures for colour pairs are kept separate from the measure for individual colours.
4. Colour vision simulation methods, and why we chose them
Several methods for calculating how colours appear under colour vision deficiencies have been published. TLF Visual QC uses methods from different papers for protan/deutan and for tritan.
| Type | Method | Reason |
|---|---|---|
| Protan, deutan | Viénot, Brettel and Mollon (1999) | A widely used method for calculating dichromat vision. It presents the red–green confusion in a form suited to checking figure palettes |
| Tritan | Machado, Oliveira and Fernandes (2009) | Viénot’s method covers only protan and deutan. Machado’s method handles all three types with the same approach and converts a colour with a single matrix |
Both were implemented from the formulas and values given in the papers. We did not extract numbers from existing software. The formulas are published in the papers and anyone can use them, but values taken from a particular software implementation carry that software’s licence with them.
5. Suggesting replacement colours (experimental)
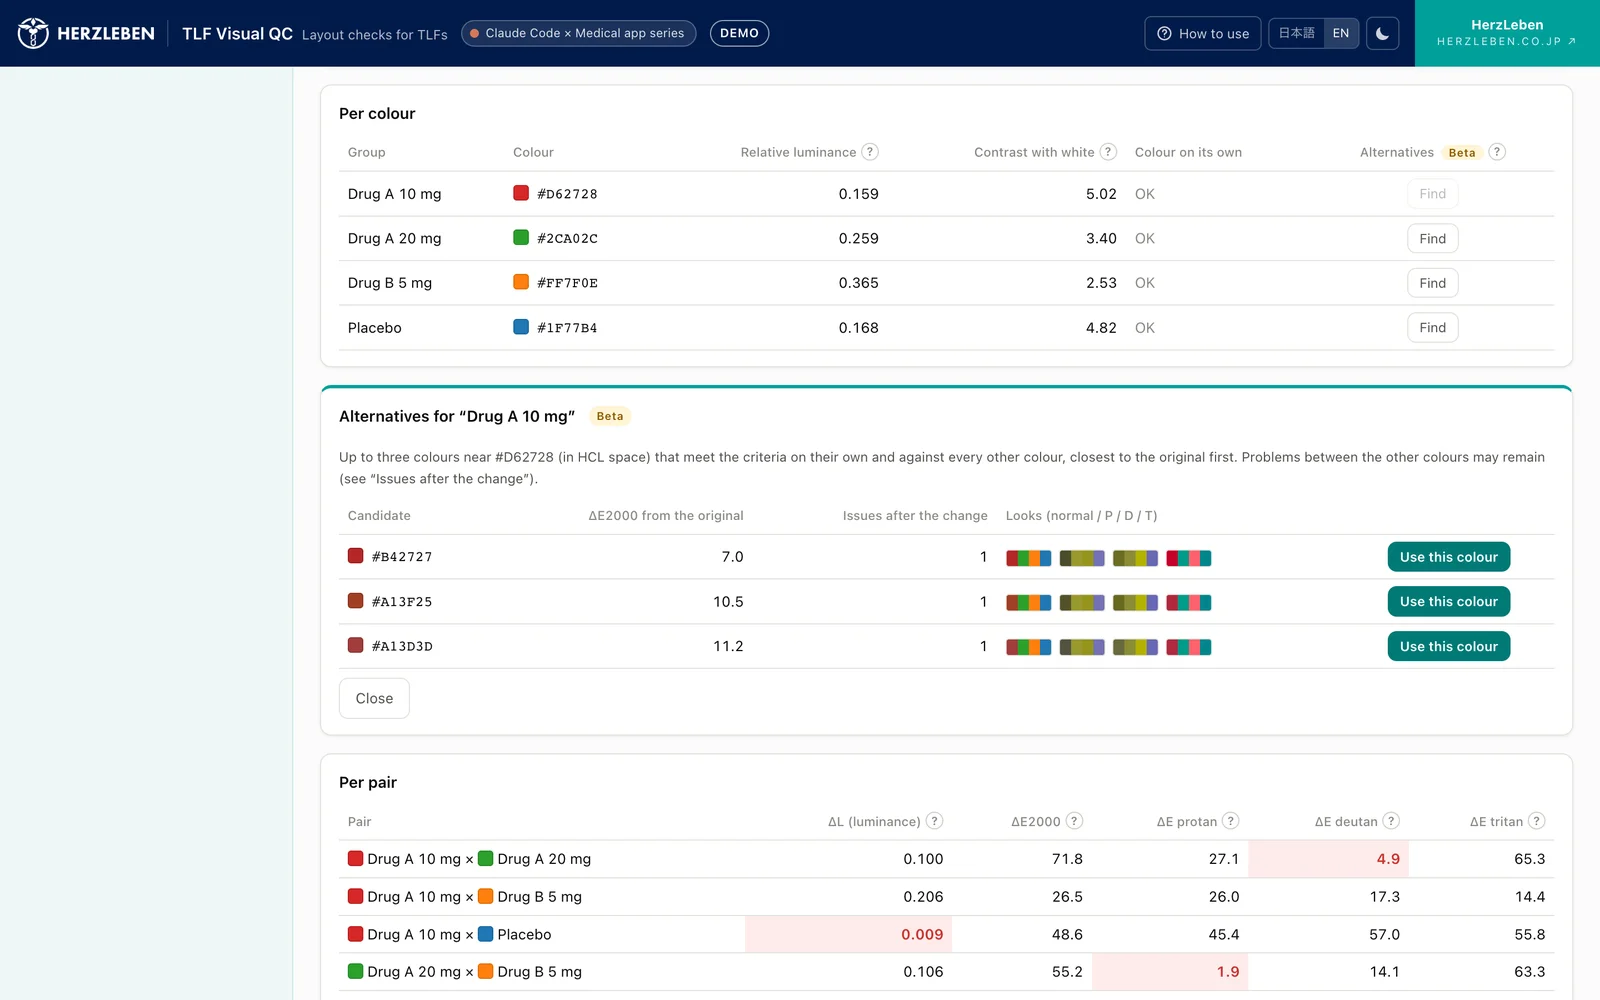
For a flagged colour, the tool can offer candidate replacement colours. On screen it is labelled “Beta”.
The selection works as follows.
- Select one flagged colour and press “Find”
- Generate many colours around the original by varying lightness, chroma and hue in small steps (lightness from 20 to 85, hue in 48 directions around the full circle)
- Keep only colours that are not too pale on a white background themselves and that meet all four measures in pairs with every other colour in the palette
- Pick up to three, in order of closeness to the original colour (candidates too similar to each other are not shown together)
Candidates closest to the original come first so that the look of the figure and the meaning of its colours (a reddish colour stays reddish, for example) change as little as possible. For each candidate, the tool shows its difference from the original and the number of flags that would remain among the other colour pairs after replacing it.
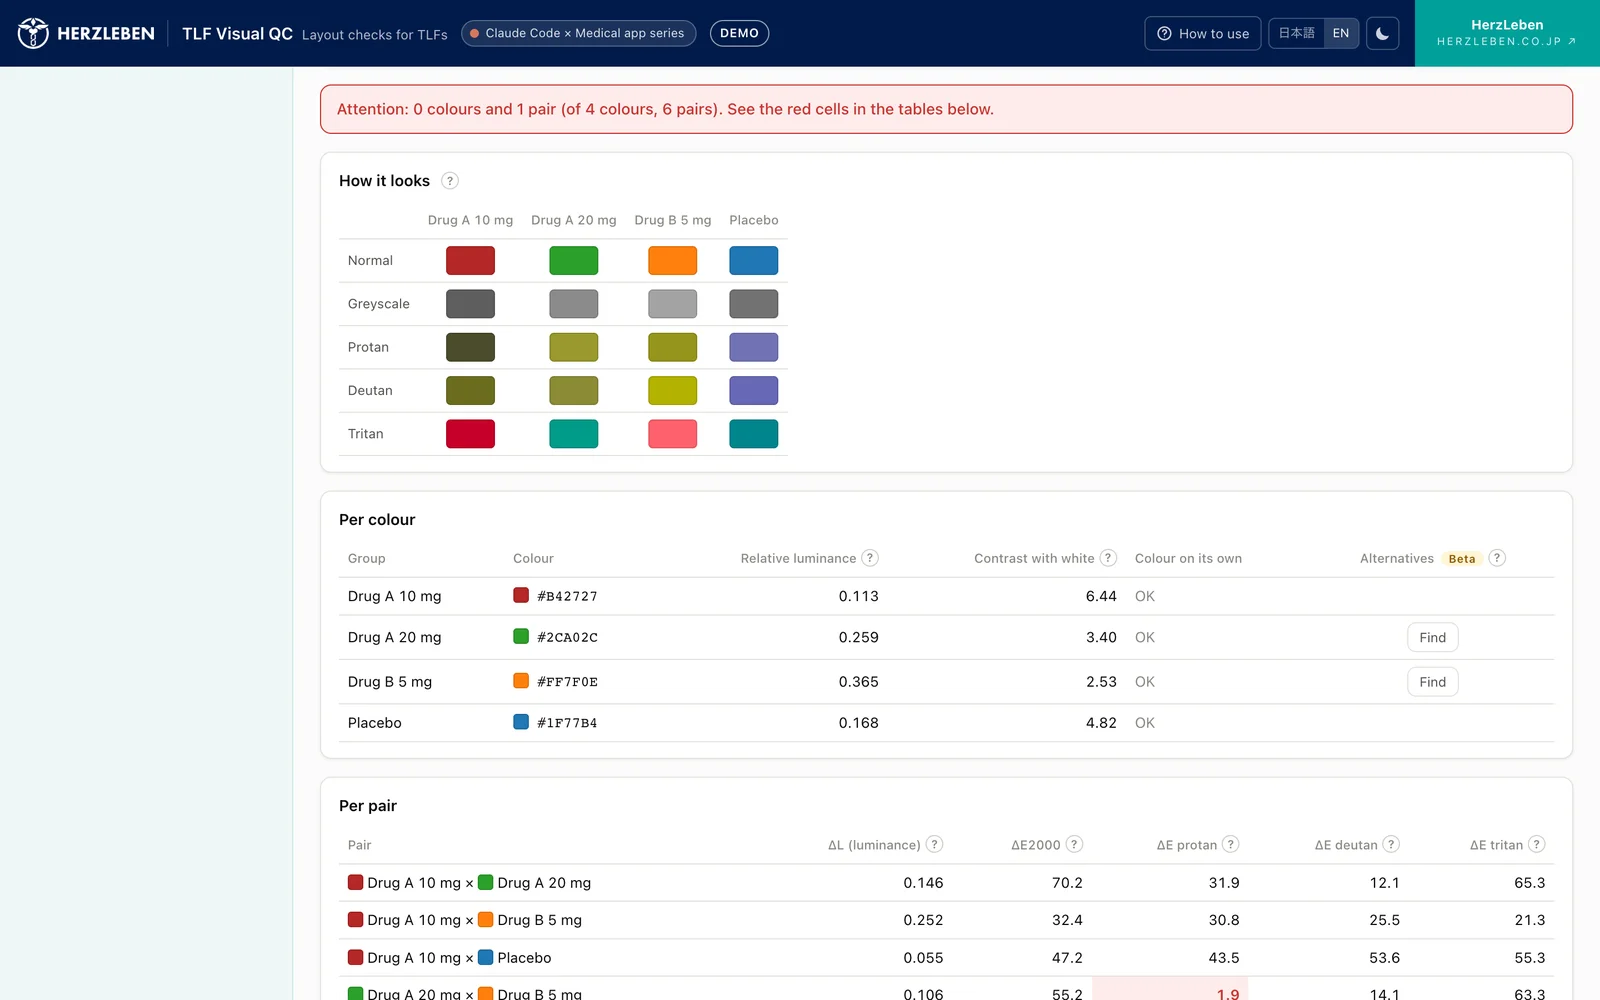
We label this experimental because choosing colours involves many rules that the measures cannot capture.
- A company or product has set colours (your own drug is always this colour, and so on)
- You want shade to show dose order, or the relationship between active drug and placebo
- You want colours to match other figures or past reports
What the tool offers are only candidates. The person making the figure decides which colour to use.
6. What we handed to Claude Code, and what people decided
| Handed to Claude Code | Decided by people |
|---|---|
| Implementing the formulas for relative luminance, ΔE2000, contrast ratio and colour vision simulation | Which measures to use, and the threshold values for flags |
| Checking the results against public test data (Sharma et al.’s 34 pairs) | Which papers to take the colour vision methods from (including the licensing considerations) |
| Preparing the seven example palettes and checking how they get flagged | Including both passing and failing palettes among the examples |
| A screen that shows the three colour vision types in one table | Labelling replacement colour suggestions as “experimental” and keeping them as candidates |
Implementing formulas is work with clear right answers, so it is easy to hand over. Even for a long formula like ΔE2000, you can confirm it was written correctly by checking it against the answers published by the formula’s authors. Deciding which answers to check against is a job for people.
On the other hand, where to draw the line and which method to treat as correct were decided by people. The colour vision methods in particular involve not only correct calculation but also licensing questions about where the formulas come from, so they cannot simply be left to the agent.
7. Summary
- Even colours that look different can become hard to tell apart in black-and-white print or for people with colour vision deficiencies
- For each pair of colours, the tool measures the luminance difference (relative luminance, below 0.05), the colour difference (ΔE2000, below 10) and the colour difference under three colour vision types (below 8); for each colour, it measures contrast with white (below 2)
- In ggplot2’s default colours, a colour difference of 34 comes with a luminance difference of only 0.002. Red and green shrink to 4.9 under deutan vision. Black and white and colour vision need separate measures
- For colour vision simulation, we implemented the method of Viénot et al. for protan and deutan and the method of Machado et al. for tritan, from the formulas in the papers
- Replacement colours stay as candidates; the person making the figure decides which colour to use
Methods for choosing distinguishable colours already exist in papers and standards. The effort lay in applying them to every figure and checking each time.
Next steps
Part 4 covers the design that performs all of these calculations inside the browser and publishes the tool without sending the outputs anywhere. It introduces the mechanism that blocks outbound traffic, a font problem that occurred only in the production environment, making the tool work with the network disconnected, and its position as a tool that has not been validated.
Sources
- Sharma G, Wu W, Dalal EN. The CIEDE2000 color-difference formula: Implementation notes, supplementary test data, and mathematical observations. Color Research & Application. 2005;30(1):21-30. https://hajim.rochester.edu/ece/sites/gsharma/ciede2000/
- Viénot F, Brettel H, Mollon JD. Digital video colourmaps for checking the legibility of displays by dichromats. Color Research & Application. 1999;24(4):243-252
- Machado GM, Oliveira MM, Fernandes LAF. A Physiologically-based Model for Simulation of Color Vision Deficiency. IEEE Transactions on Visualization and Computer Graphics. 2009;15(6):1291-1298. https://www.inf.ufrgs.br/~oliveira/pubs_files/CVD_Simulation/CVD_Simulation.html
- W3C. Web Content Accessibility Guidelines (WCAG) 2.2 (definitions of relative luminance and contrast ratio; 3:1 for non-text contrast). https://developer.mozilla.org/en-US/docs/Web/Accessibility/Understanding_WCAG/Perceivable/Color_contrast
- U.S. FDA, Portable Document Format (PDF) Specifications, v4.1 (September 2016). https://www.fda.gov/media/76797/download
- Japan Ophthalmologists Association, What is congenital colour vision deficiency? (April 1, 2018) (in Japanese). https://www.gankaikai.or.jp/colorvision/20180415_color.pdf
- The idea of checking colours was presented at an R/Pharma 2026 workshop. The calculations on this page are based on the formulas in the published papers and standards above
- The group names in the example palettes (Drug A 10 mg, etc.) are fictitious