
Claude Code × Medical Application
[Business Explainer] TLF Layout Checks — Page-Break and Colour Requirements for Analysis Outputs
1. About this page
This is a reference page that explains the TLF layout checks covered in the series “Turning Visual Checks into Automated Checks,” kept separate from the main articles. It aims to answer, on one page, questions such as “What is a TLF?”, “Where is it used, and who reads it?” and “What exactly are we checking in the layout?”
- Hundredsof pagesnot unusual for the TLFs of a single study
- 9–10ptthe font size the US FDA recommends for tables in PDFs
- About 5%share of men in Japan with congenital colour vision deficiency (about 0.2% of women)
- 1 changeadding a single footnote line can shift every page break after it
All output images on this page are dummies created with fictitious data. They are not related to any real study, drug or company.
2. What is a TLF?
2-1. Tables, listings and figures
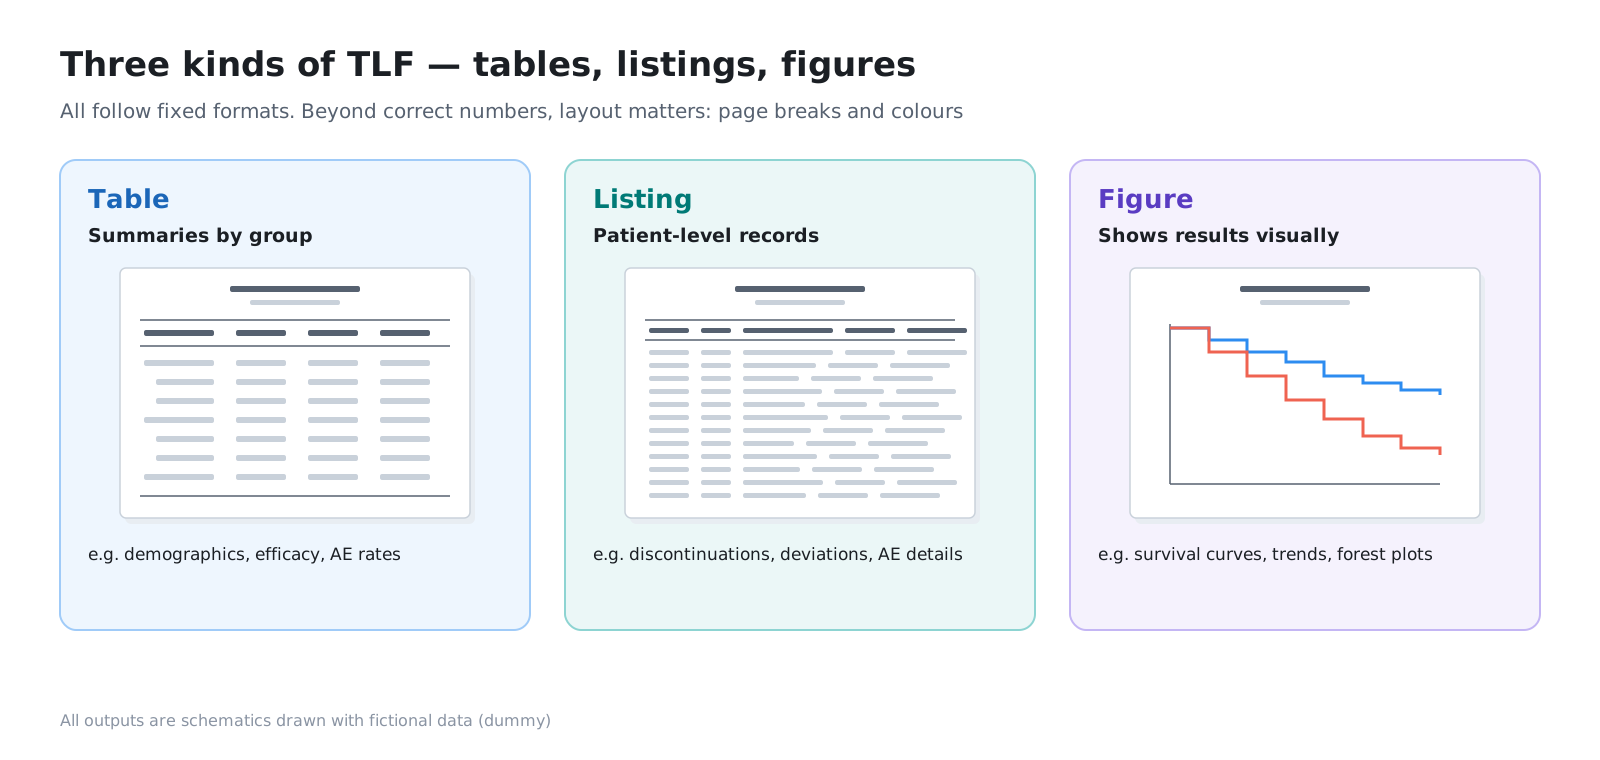
TLF stands for tables, listings and figures: the results of analysing clinical trial data, laid out as outputs in a fixed format.
- Tables: summaries by group, such as demographics, efficacy results and adverse event incidence
- Listings: records for each patient, one by one, such as discontinued patients, protocol deviations and adverse event details
- Figures: survival curves, trend plots, forest plots and so on
2-2. How TLFs are produced
The shape of a TLF is fixed before the analysis starts. The statistical analysis plan (SAP) decides what is analysed, and the TLF shells (also called mock-ups) fix the table frames, columns and footnotes. Once the data are locked, programs produce the outputs from the analysis datasets.
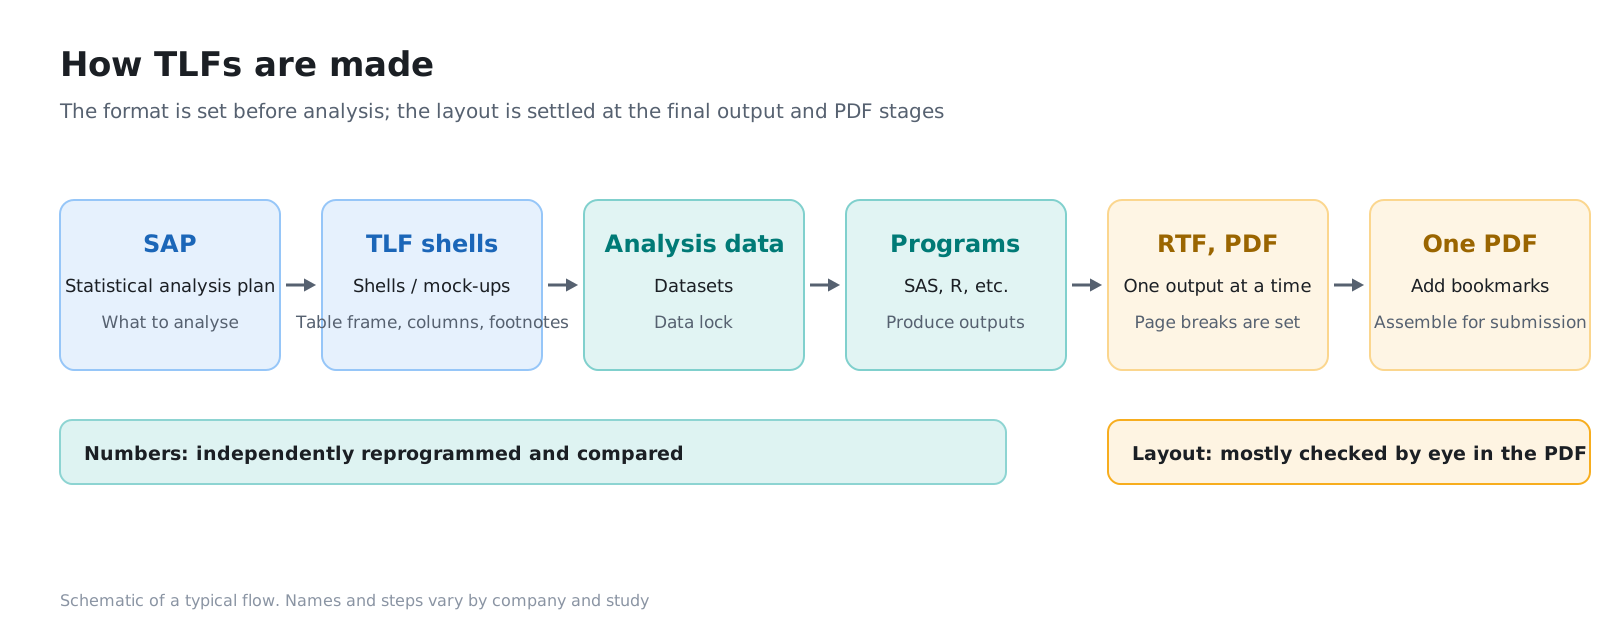
Outputs are usually RTF or PDF, and at the end they are combined into a single PDF with bookmarks. The numbers are checked by methods such as independent double programming, where a second programmer reproduces the same analysis and the results are compared. The layout, on the other hand — where each page breaks, whether the figure colours can be told apart — is in most cases checked by someone opening the PDF and looking.
3. Where TLFs are used
3-1. Clinical development — the CSR and the submission
The biggest use of TLFs is the clinical study report (CSR) and the submission dossier built from it.
ICH E3, which defines the structure of the CSR, places summary tables of the main results in the body text, while tables and figures that would make the text hard to read because of their number or size are collected in Section 14 and referred to from the text. Patient-level listings go in Appendix 16.2. Section 14 holds the demographic, efficacy and safety tables and figures; 16.2 holds listings of discontinuations, deviations, adverse events and so on.
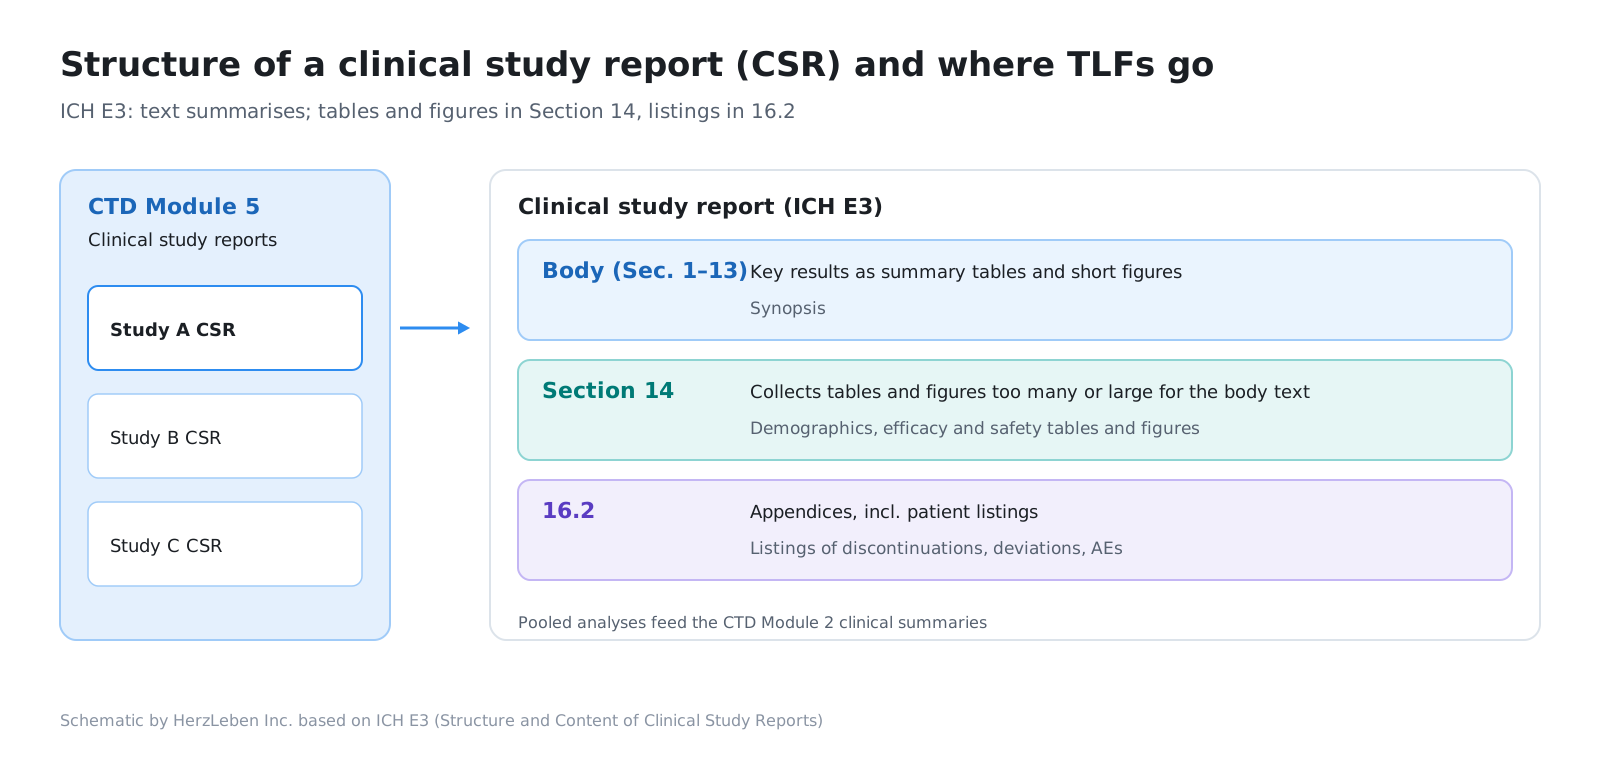
The CSR goes into CTD Module 5, and analyses that pool several studies feed the clinical summaries in Module 2. It is submitted to the PMDA in Japan and the FDA in the US, mostly as PDFs inside the electronic format (eCTD). Even after review starts, additional analyses are often run to answer regulators’ questions, and the results are issued as new TLFs.
Clinical development also produces TLFs for other purposes, such as:
- Data monitoring committees: reports that check safety and efficacy while the study is ongoing
- Periodic safety reports: annual reports summarising safety information during development, among others
- Internal decisions: materials for meetings that decide, based on study results, whether to move to the next study
3-2. Medical affairs — congresses, publications and information for healthcare professionals
From around the time of approval, medical affairs also uses TLFs more and more.
- Additional analyses: re-analysing results in subgroups (age, severity and so on) or long-term follow-up data to answer questions from healthcare professionals
- Congress presentations and publications: posters, oral presentation slides and journal figures and tables are built from TLFs
- Information for healthcare professionals: materials for MSLs (medical science liaisons) and responses to medical enquiries
Here, figure colour becomes a bigger issue: congress projectors, journals printed in black and white, readers with different colour vision. Compared with development outputs, these settings more often rely on colour to distinguish groups in a figure.
3-3. Who reads them
| Reader | Role | When the layout is broken |
|---|---|---|
| Statisticians and programmers | Produce the outputs and check the numbers | Rework and rechecking go round in circles |
| Medical writers | Cite the outputs in the text and assemble the report | Positions and page numbers of cited tables shift |
| QC reviewers | Check output consistency before submission | The more pages, the more is missed |
| Regulatory reviewers | Read the dossier and make decisions | Time spent hunting for table continuations; a source of misreading |
| Physicians and healthcare professionals | Read results at congresses and in journals | Group differences cannot be read from the colours |
4. Layout requirements
4-1. Regulators’ PDF requirements
Each regulator has requirements for how submitted PDFs are made.
- US FDA (PDF Specifications v4.1)
- Pages fit on US Letter paper (8.5 × 11 inches), with a left margin of at least 3/4 inch and at least 3/8 inch on the other sides
- Text is 9–12 point. For tables, 9–10 point is recommended, and smaller fonts should be avoided
- Black text is recommended. Light colours do not print well on greyscale printers, so any colours used should be checked with a test print before submission
- Japan PMDA (guidelines for preparing the electronic CTD)
- Japanese body text is in principle 10.5 point, and text in figures and tables must be legible (for example, 8 point or larger)
- Text is in principle black. Avoid light colours that do not print properly on black-and-white printers
Both assume that reviewers print and read on paper, and that it may be printed in black and white.
4-2. Page breaks — no regulatory rule, so company standards apply
Regulatory requirements do not specify where pages should break. For readability, though, many companies have their own output standards. Common ones include:
- When a table runs over a page, repeat the column headers on the next page
- Do not split the rows of a single group or a single patient across a page break
- Do not leave just one or two rows at the bottom of a page and push the rest to the next
- Do not wrap columns onto the next page while leaving a large empty area on the right of the page
4-3. Figure colour — black and white, and colour vision
There are two things to check about figure colour.
- In black and white: two colours that differ in hue but are close in lightness (such as red and green) look like the same grey when printed in greyscale
- Colour vision differences: in Japan, about 5% of men and about 0.2% of women have congenital colour vision deficiency. Difficulty telling red from green (protan and deutan) is common; difficulty telling blue from yellow (tritan) is rare
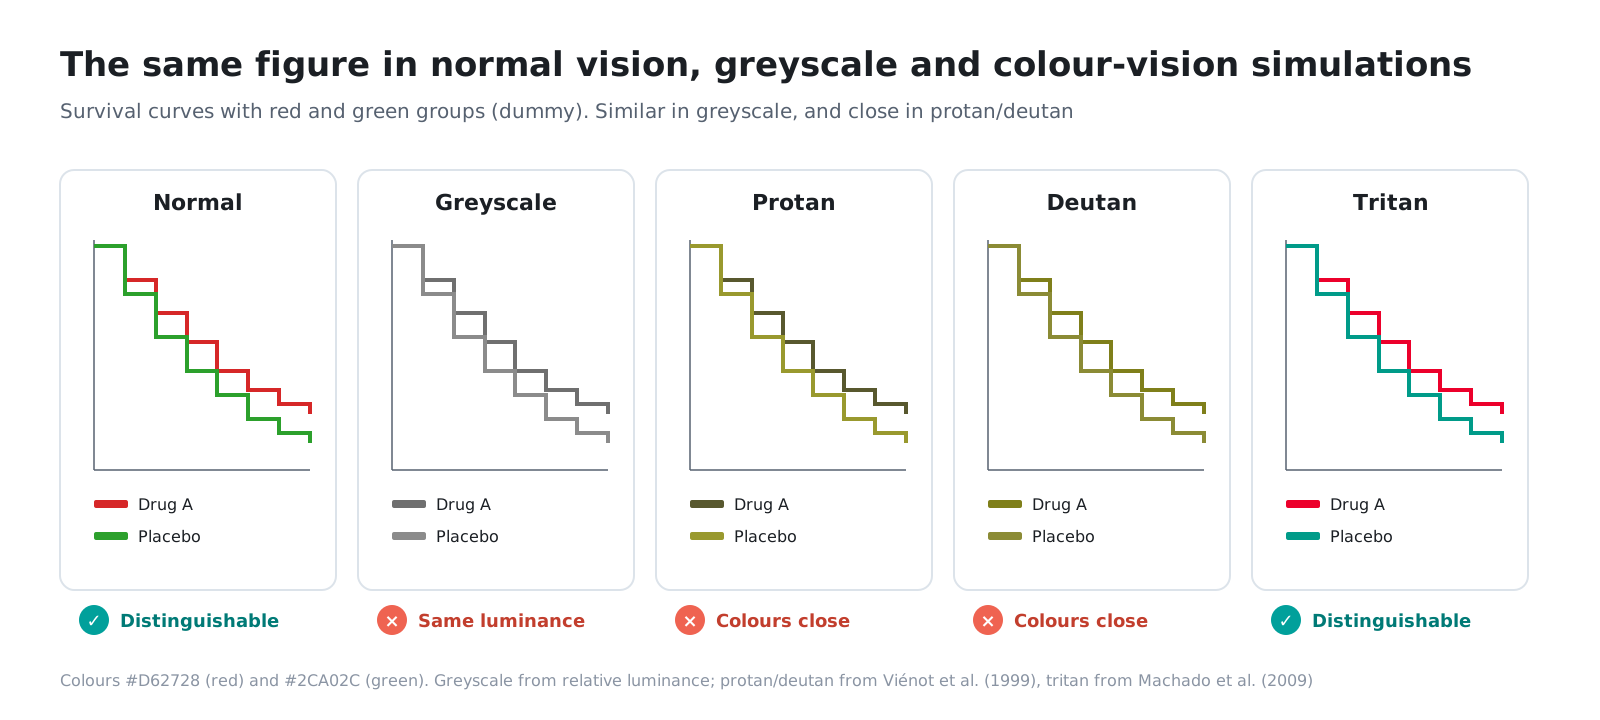
Changing line types (solid and dashed) or markers lets readers distinguish groups without relying on colour. But in figures with many groups, or bar charts filled by group, the choice of colours itself matters.
5. Why page breaks go wrong
5-1. One change ripples through every page after it
Page breaks in an output are determined by how many rows fit on a page. If the row count changes by even one, the last row on that page is pushed to the next, and the breaks on all later pages shift in turn.
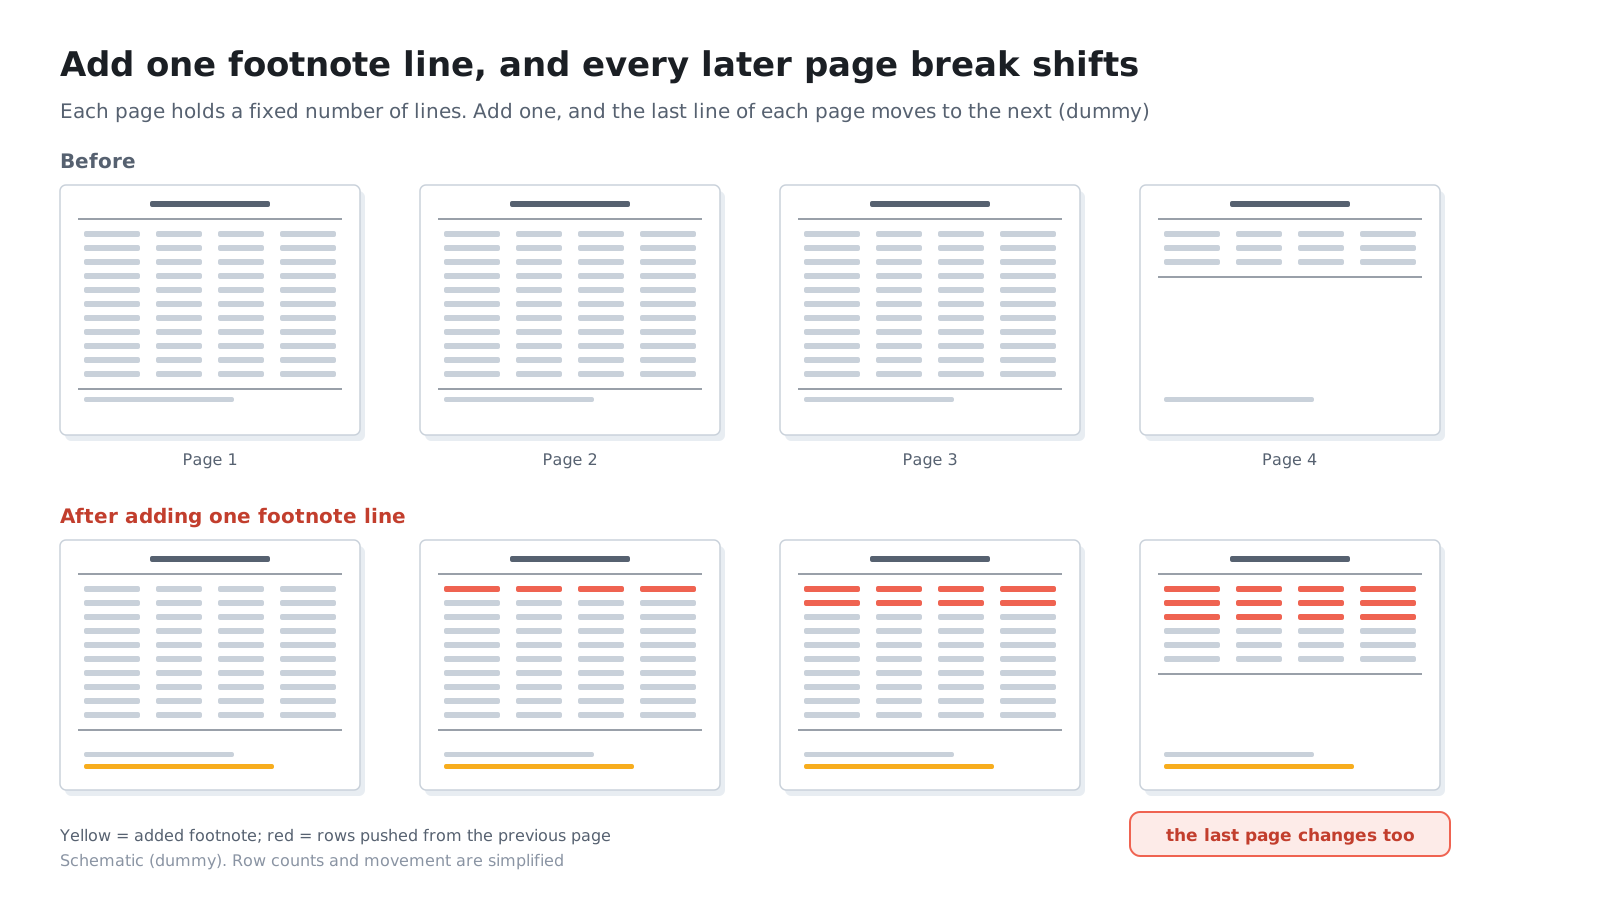
Everyday work offers plenty of triggers for a change in row count.
| Trigger | Example |
|---|---|
| Adding or changing a footnote | One line added to explain an abbreviation or the analysis population |
| Long text | A long adverse event term or drug name wraps onto two lines in a cell |
| Column widths and digits | An extra decimal place, or an extra group |
| Data updates | The data were re-locked and patients or events were added |
| Font differences | A different font was substituted in the PDF-assembly environment, changing character widths |
| Page orientation | An output set up as portrait was put into a landscape bundle |
5-2. What broken pages look like
Broken pages show up in forms like the ones below. In every case the numbers are correct, so number checks will not find them.
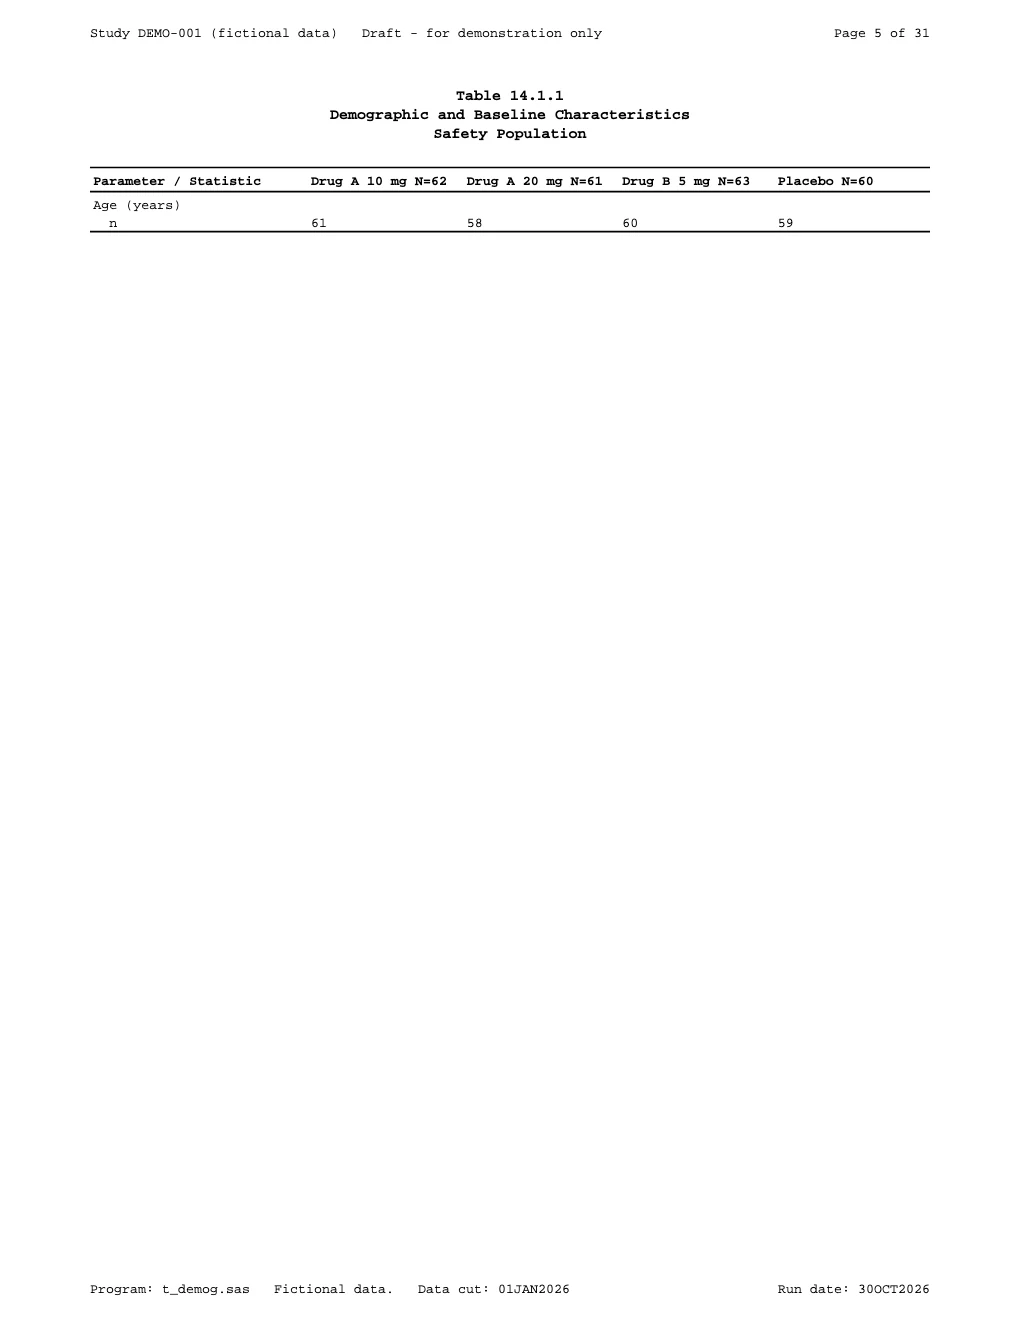
Only one or two rows remain, leaving a large empty area at the bottom (dummy) 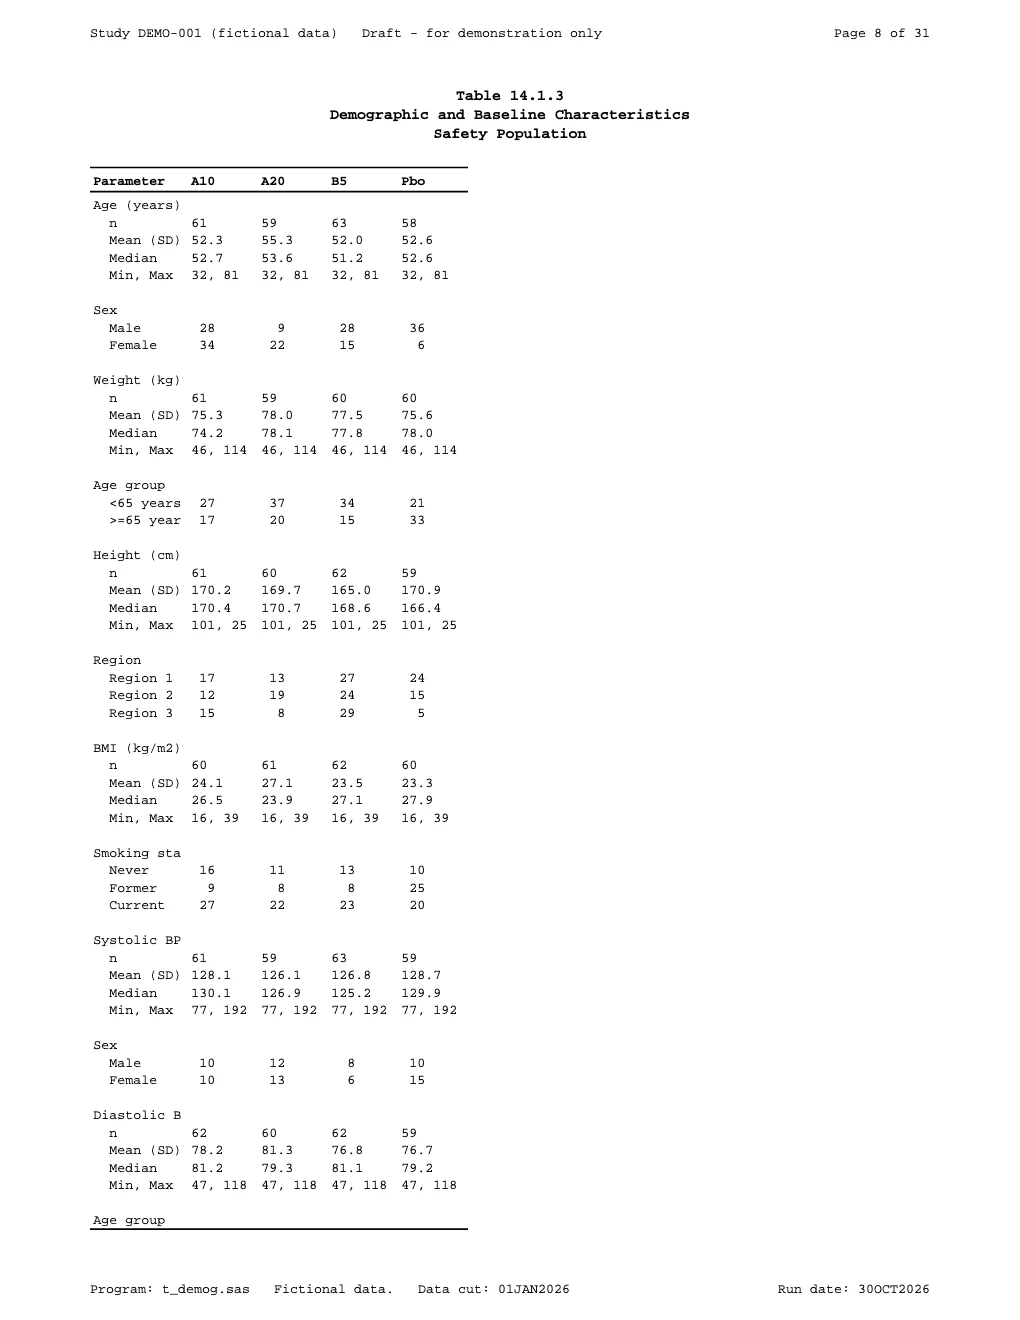
Columns were pushed to the next page, leaving a large empty area on the right (dummy) 
Only headings and footnotes, with almost no content (dummy) 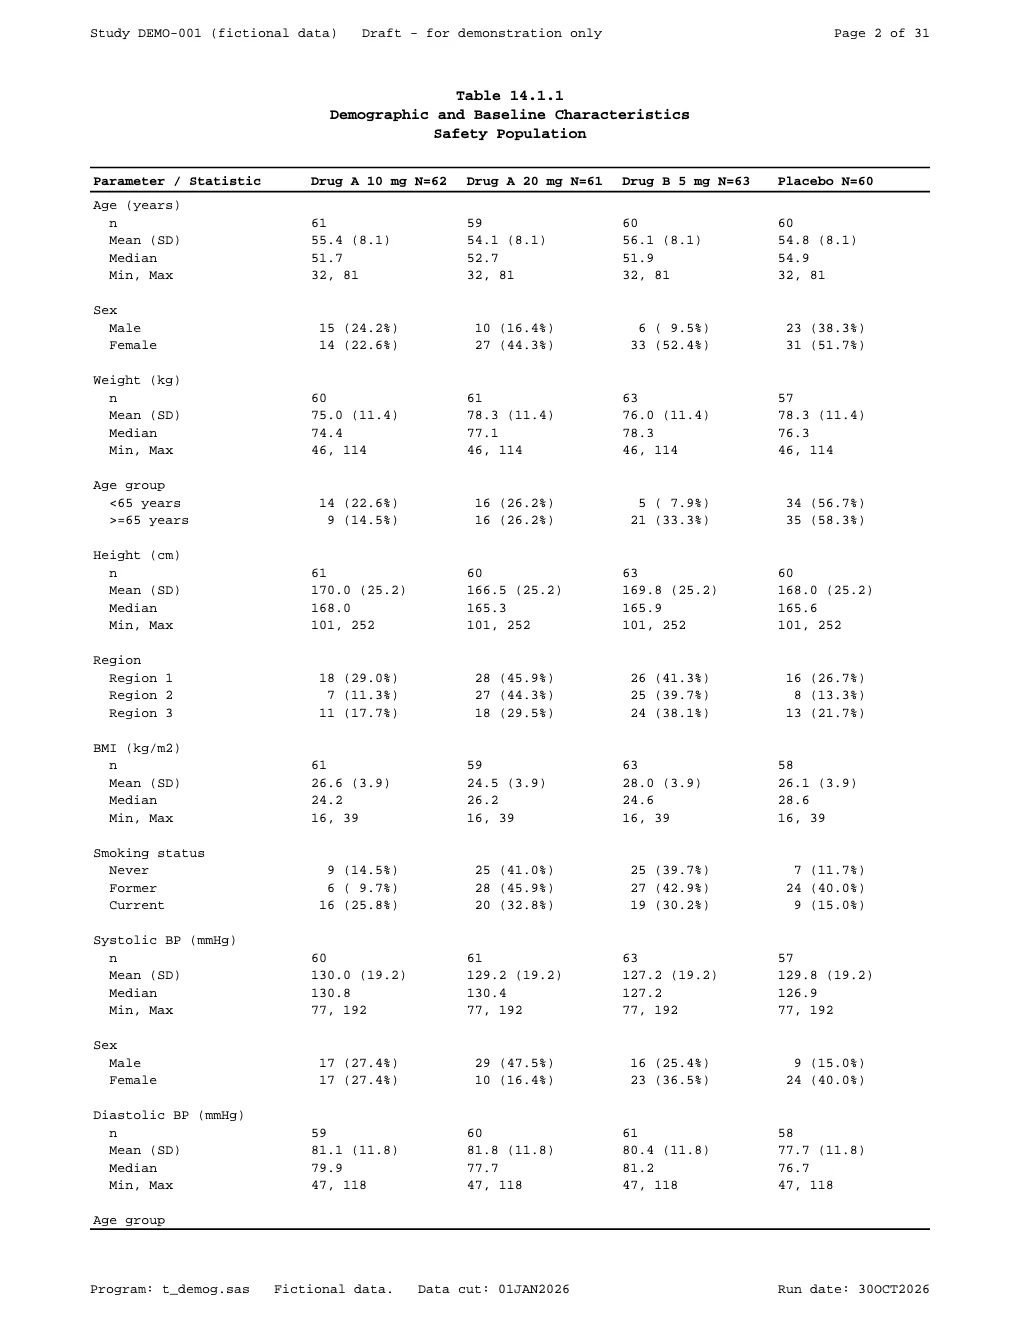
A normal page for comparison (dummy)
What broken pages have in common is unnaturally large white space at the bottom edge or the right edge of the page. In the main articles of the series, we find broken pages by measuring the size of that white space.
6. Today’s checks and their limits
6-1. Looking at every page
Page breaks and figure colours are, in most cases, checked by someone paging through the PDF one page at a time.
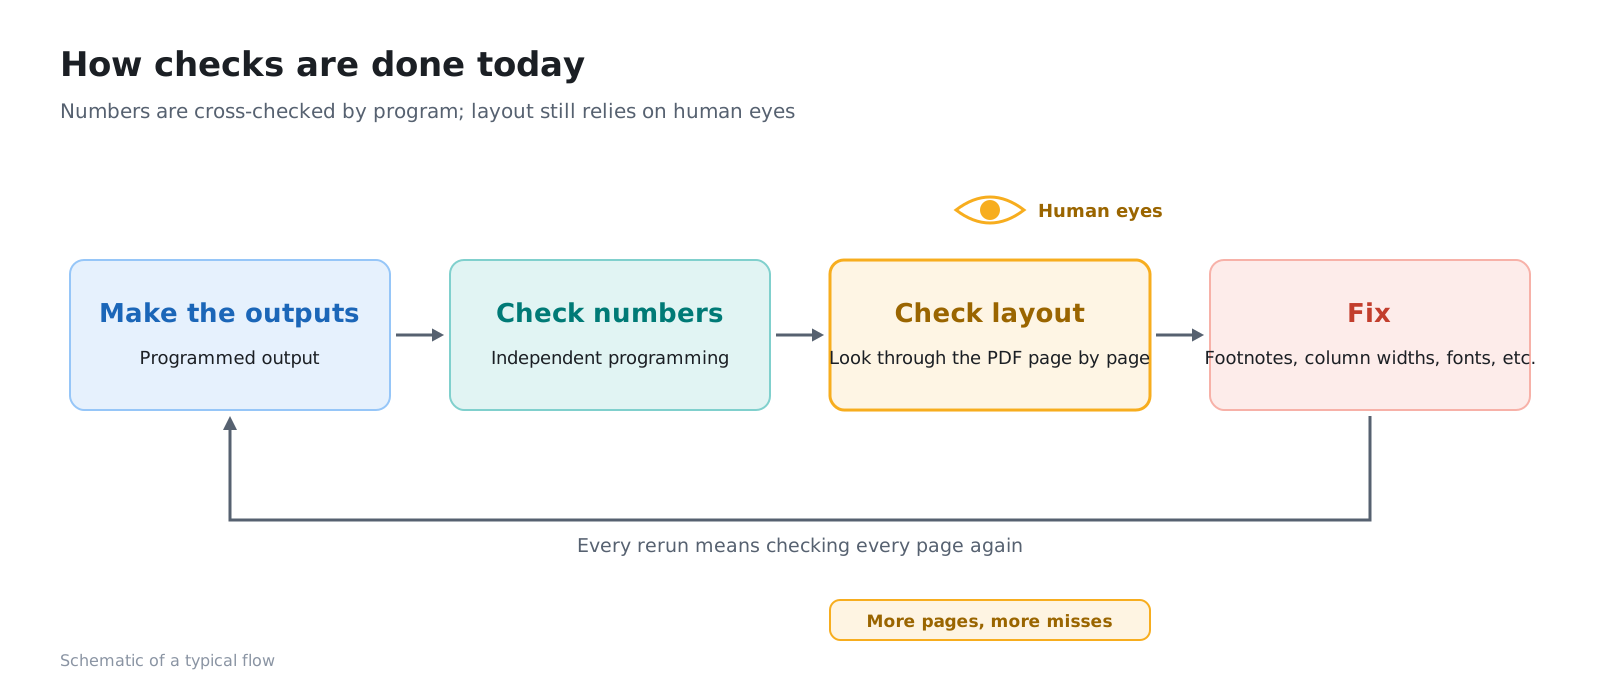
This approach has limits:
- The more pages, the more is missed: concentration does not last across hundreds of pages
- Every rerun means another full review: even a one-line footnote fix means reviewing every page after it
- It lands right before the deadline: between data lock and submission, the time available for layout checks tends to be short
- The standard varies by person: “how much space counts as broken” depends on who is looking
6-2. The idea behind automated checks
Layout checks cannot be handed entirely to a machine, but a machine can narrow down the pages and colour pairs a person needs to look at.
- Page breaks: measure the share of white at the bottom edge and right edge of each page, and flag pages where it is large. This method is based on a paper presented at PharmaSUG 2026 (Yi Guo, Paper AP-233)
- Figure colours: for each pair of colours used for groups, calculate the lightness difference in greyscale, the colour difference itself, and how the pair looks under different colour vision, and flag pairs that are hard to tell apart
TLF Visual QC, introduced in the series, does both of these entirely inside the browser, without sending the PDF anywhere. Its results are an aid to visual review; final decisions follow each company’s own procedures.
7. Primary sources
- ICH E3 Structure and Content of Clinical Study Reports — the tables, figures and listings placed in the body, Section 14 and 16.2
- FDA Portable Document Format (PDF) Specifications v4.1 — paper size, margins, font size and colour
- Guidelines for preparing the electronic CTD (PMDA, in Japanese) — fonts and text colour for PDFs in Japanese submissions
- What is congenital colour vision deficiency? (Japan Ophthalmologists Association, in Japanese) — prevalence of colour vision deficiency
- PharmaSUG 2026 Paper AP-233 — the method for finding page breaks from the share of white space
8. Summary
- TLFs are the tables, listings and figures of clinical trial results. Clinical development uses them in the CSR and submission dossier; medical affairs uses them for additional analyses, congress presentations, publications and information for healthcare professionals
- Regulators set requirements for font size and colour in PDFs, assuming they may be printed in black and white. Page breaks are governed by company standards
- A single footnote line or a wrapped text string can break the layout of every later page. Broken pages show unnatural white space at the bottom edge or right edge
- Figure colours become hard to tell apart in greyscale and under different colour vision
- Numbers are checked by program, but layout still relies on human eyes. An automated check can narrow down the pages and colours that need to be looked at
Next steps
The main articles of the series introduce TLF Visual QC, a tool that runs these two checks automatically, together with how we developed it with Claude Code. We cover how page breaks are detected, how the results were verified, how colours are checked, and how the tool is published without ever receiving an output.
Sources
- ICH E3, Structure and Content of Clinical Study Reports. https://www.fda.gov/media/71271/download
- U.S. FDA, Portable Document Format (PDF) Specifications, v4.1 (September 2016). https://www.fda.gov/media/76797/download
- MHLW Pharmaceutical Evaluation Division notification, Partial revision of "Handling of the electronic specifications for the Common Technical Document" (PSEHB/PED Notification No. 0824-3, August 24, 2016), Attachment 1, "Guidelines for preparing the electronic Common Technical Document" (in Japanese). https://www.pmda.go.jp/files/000213999.pdf
- Japan Ophthalmologists Association, "What is congenital colour vision deficiency?" (April 1, 2018) (in Japanese). https://www.gankaikai.or.jp/colorvision/20180415_color.pdf
- Yi Guo. Detecting Abnormal Page Breaks Using Grayscale Pixel-Density Analysis in R Shiny. PharmaSUG 2026, Paper AP-233. https://pharmasug.org/proceedings/2026/AP/PharmaSUG-2026-AP-233.pdf
- The output images on this page are dummies created with fictitious data. They are not related to any real study, drug or company