
Claude Code × Medical Application
[Claude Code] Treatment Pathways on One Page, Part 3: Verifying the Results — Fictitious Patient Data with the Answers Set First
1. Introduction — a chart appearing is not the same as the counts being right
A Sankey diagram looks plausible as soon as you load some data. That is exactly why a chart appearing on the screen and its patient counts being correct are two different things.
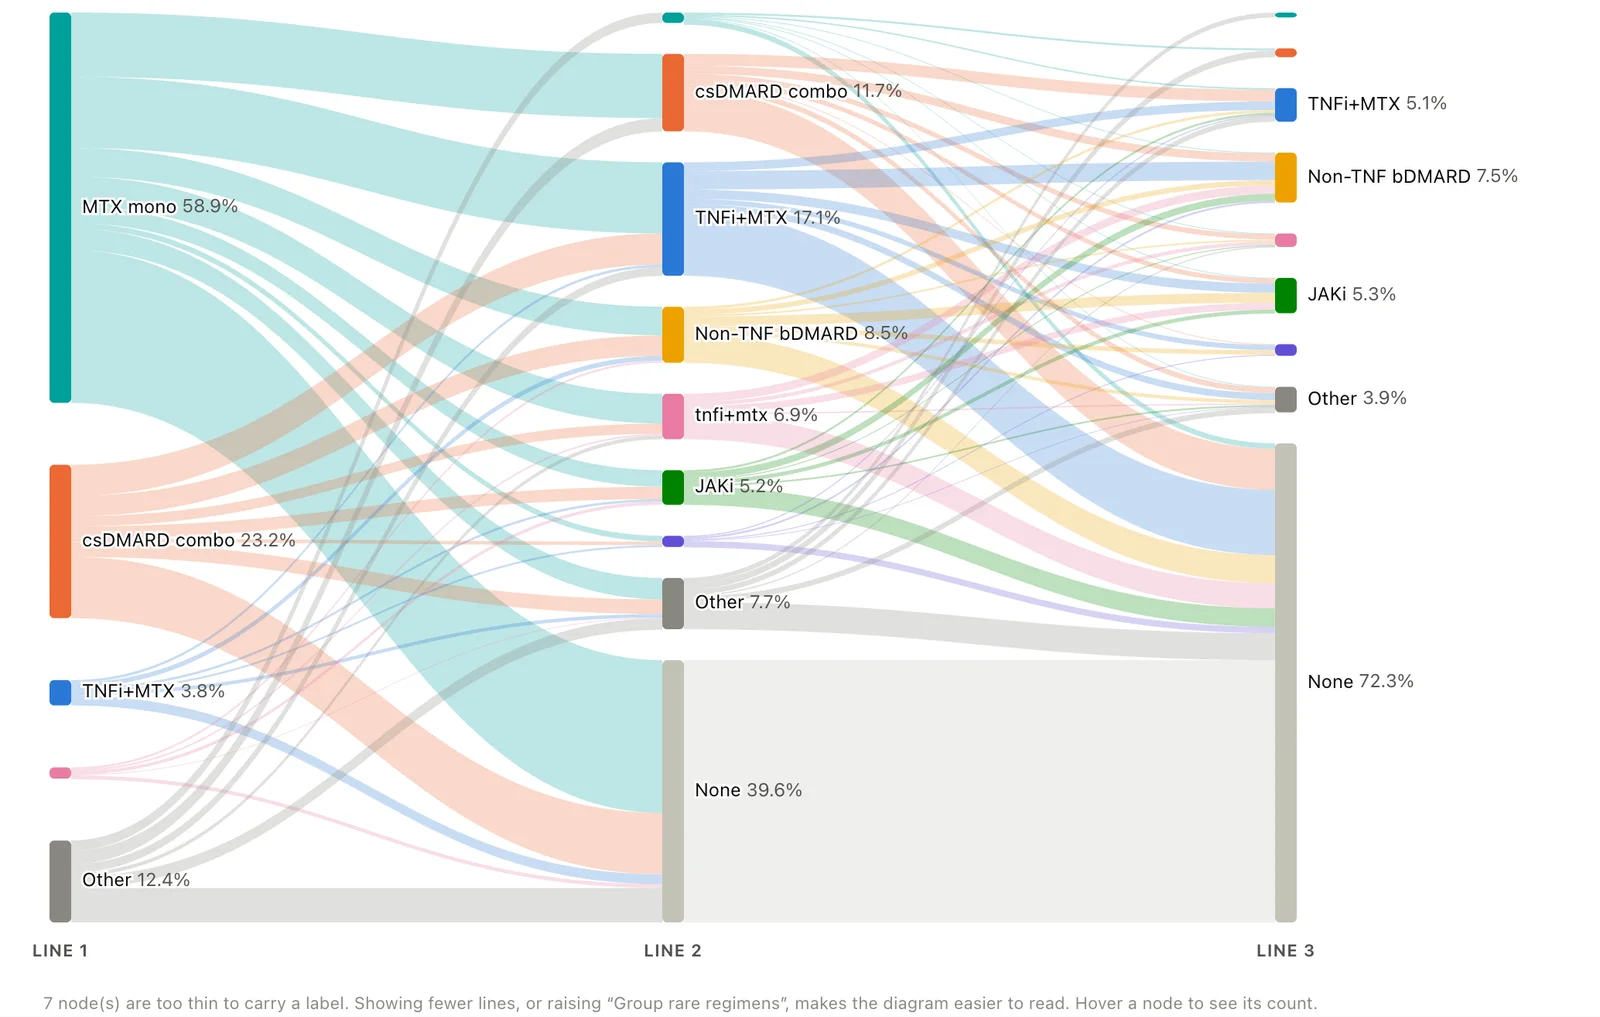
- If the same treatment is written in two ways, its bar splits in two, and both look thin
- If patient IDs are duplicated, the same person is counted twice
- If the second-line column is read one column off, the transitions are entirely different
None of these can be spotted just by looking at the chart. A tool meant to show how treatment actually happens is pointless if it neglects to check its own numbers.
In this post we show how we checked the numbers of the Treatment Line Sankey Diagram at four levels.
- The whole: compare patient counts with fictitious patient data whose answers were set first
- Breakage: watch how loading and the data quality checks behave on deliberately broken input
- Name variants: check the merge proposals from both rules and AI against the answers
- Size: measure the speed on a 100,000-row file
- 145 / 145itemsitems where the answer file and the tool’s totals matched
- 10 / 10runsruns in which the AI’s proposals (column mapping and name variants) matched the answers
- 21warningswarnings raised by the data quality checks on the deliberately broken input
- about 0.9sloading and checking a 100,000-row file
2. The whole — fictitious patient data with the answers set first
2-1. Why generate fictitious data yourself
Real prescription data cannot be put into a public tool. Even with publicly available data, the answer to “how many patients received what, and where did they move from and to” has to be counted by someone after the fact. That leaves room to look at the result and decide it is “roughly right”.
So we turned this around: set the answers first, then generate the data.
2-2. Fictitious rheumatoid arthritis patient data
The fictitious data built into the tool covers 3,000 rheumatoid arthritis patients.
| Item | Content |
|---|---|
| Patients and columns | 3,000 patients, 34 columns, up to Line 5 |
| Column layout | The layout of an analysis listing (group names tx_groupname_1 to 5, start and end dates, individual regimen names, sort-order codes, facility, sex, age, lab values and so on) |
| Treatment groups | MTX monotherapy, csDMARD combination, TNF inhibitor + MTX, non-TNF biologics, JAK inhibitors, other (drugs are given only as generic names and drug classes) |
| Planted name variants | tnfi+mtx at facility B (upper/lower case), JAKi at facility C (full-width characters) |
| How it is generated | A program with a fixed random seed. It produces the same data every time |
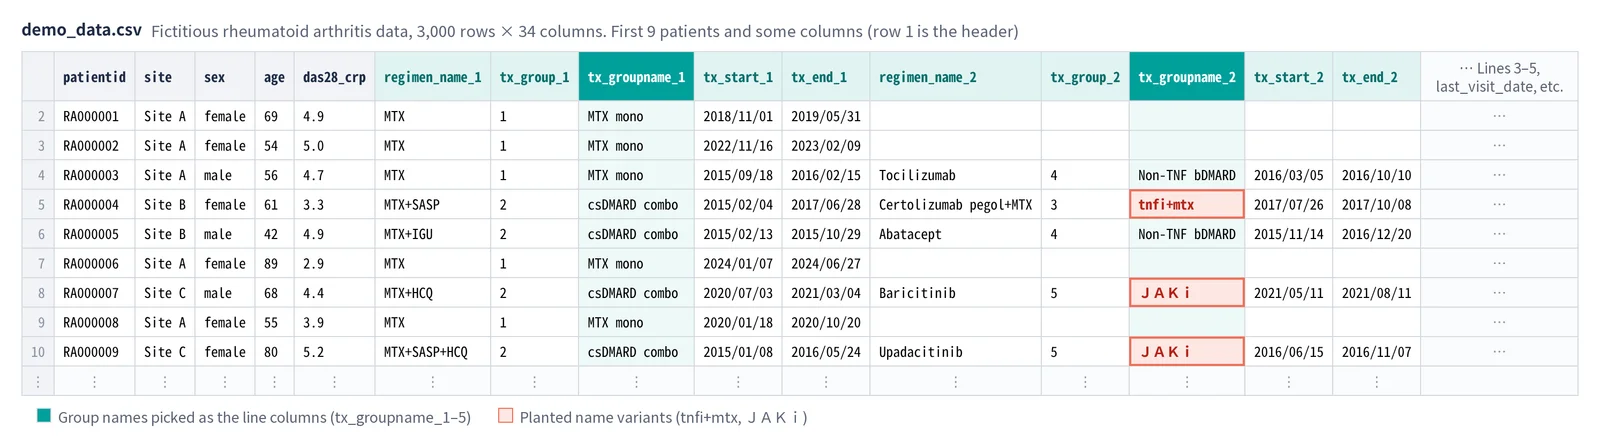
One patient’s record looks like this, for example.
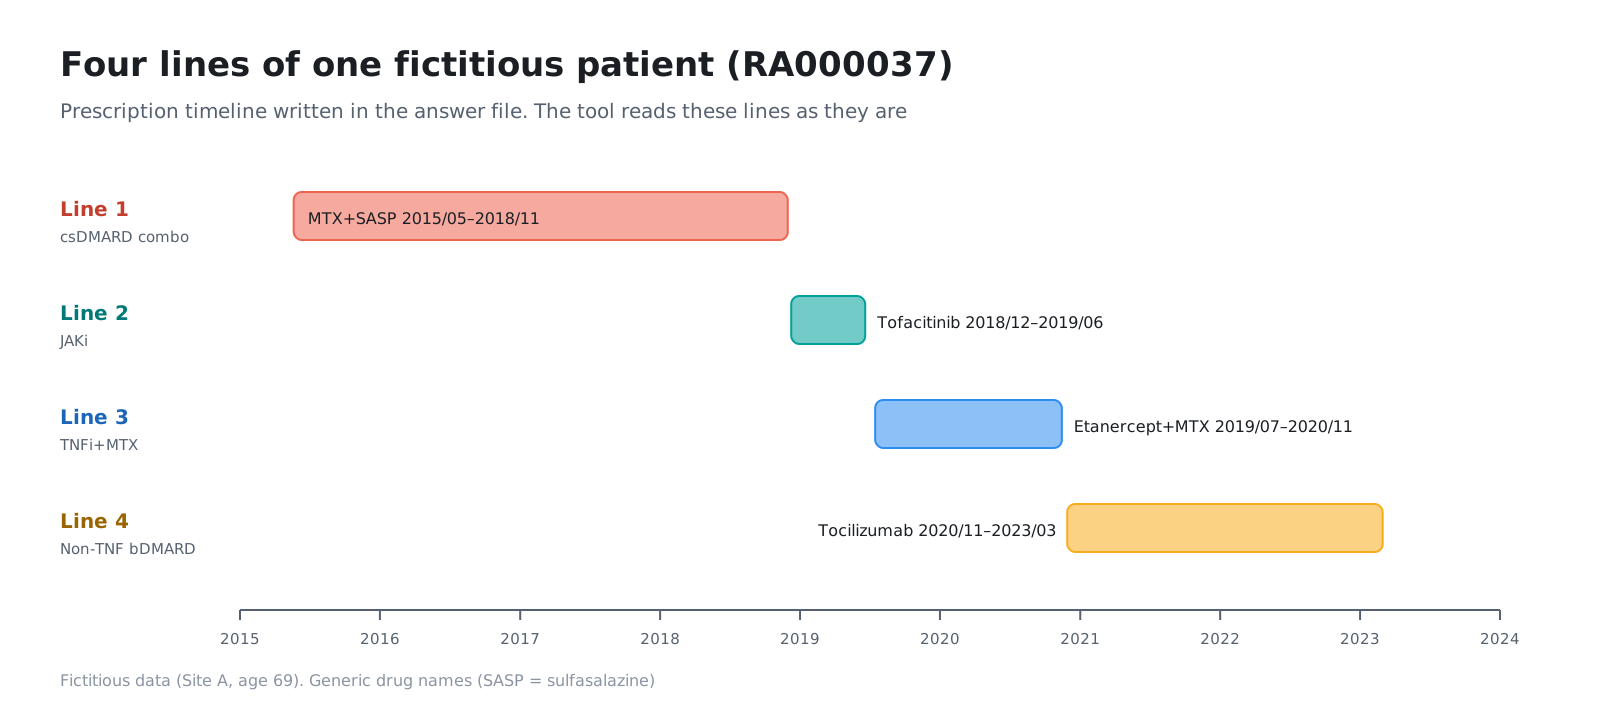
2-3. Writing out the answers at the same time
The program that generates the data writes out an answer file (JSON) at the same moment.
- The number of patients for each treatment in each line
- How many patients moved from a given treatment in one line to each treatment in the next line
- The pairs of planted name variants, and the count for each
We load the fictitious data into the tool, merge the name variants, and then compare the resulting totals with these answers item by item.
2-4. Results
| What was compared | Number of items | Matched |
|---|---|---|
| Patient counts by line | 32 | All |
| Patient counts for transitions to the next line | 111 | All |
Counts of name variants (tnfi+mtx 348, JAKi 131) |
2 | All |
| Total | 145 | 145 |
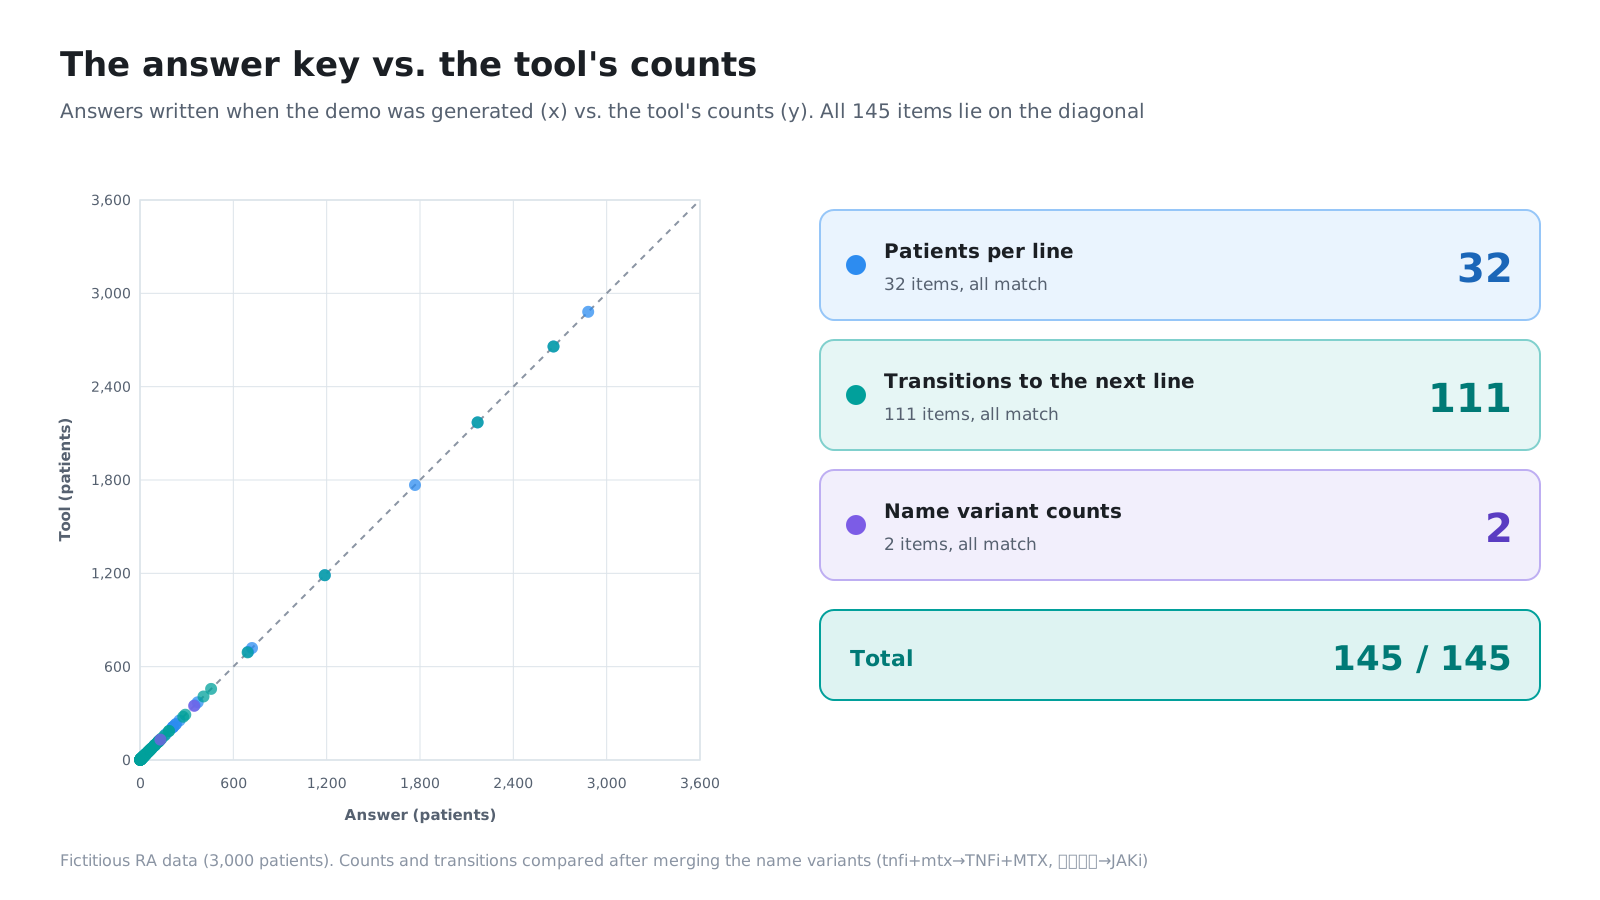
This comparison is written as a test and runs automatically every time the tool is changed. Whenever we rebuilt the screens or revised the rules for the checks, we could confirm each time that the totals had not changed.
3. Breakage — deliberately broken input
3-1. Deciding how to break it
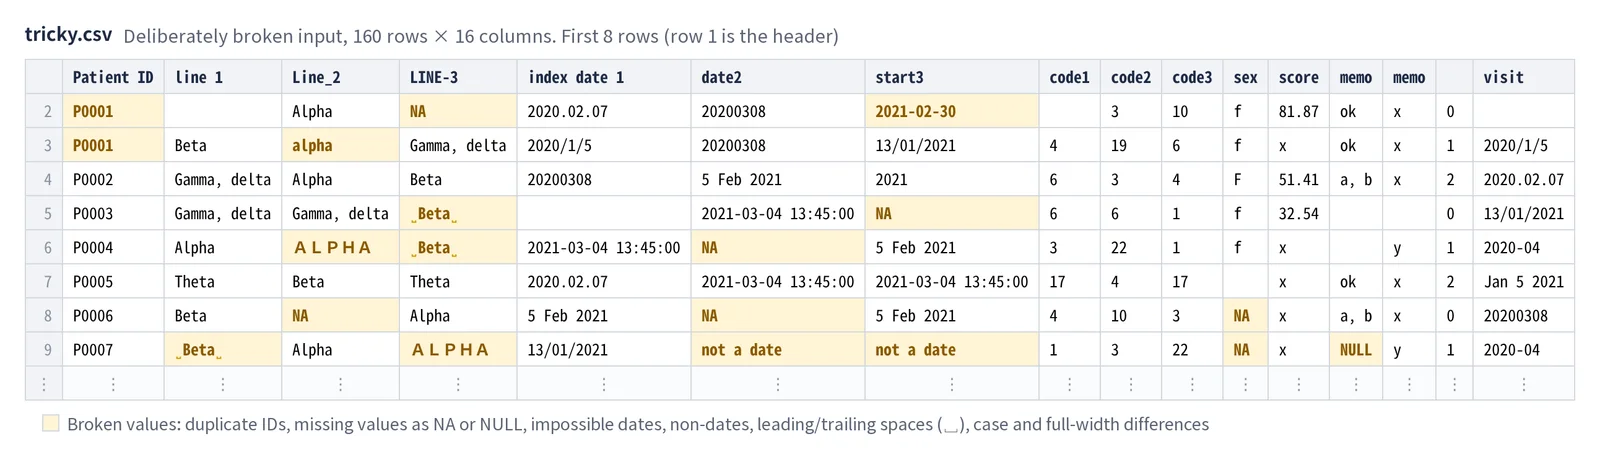
Real files have untidy parts. So, separately from the fictitious data, we prepared a small piece of deliberately broken input (160 rows, 16 columns). It is broken in the following eight ways.
| How it is broken | Examples |
|---|---|
| Shape of column names | Inconsistent case and separators (line 1, Line_2, LINE-3) |
| How missing values and values are written | Blanks, NA, null and so on mixed together. Some values have leading and trailing spaces (" Beta ") |
| Quotation marks | Delimiters and line breaks inside quotation marks |
| Date formats | 2020-01-05, 2020/1/5, 20200105 and others mixed together |
| IDs | Exponential notation (1.05E+17) and duplicated IDs |
| Skipped lines | First-line therapy is blank but second-line therapy has a value |
| Blank rows in the middle | Empty rows in the middle of the data |
| Line endings | Windows line endings (CRLF) |
3-2. Results
- Column mapping: even with the column names out of shape, the columns were matched by name
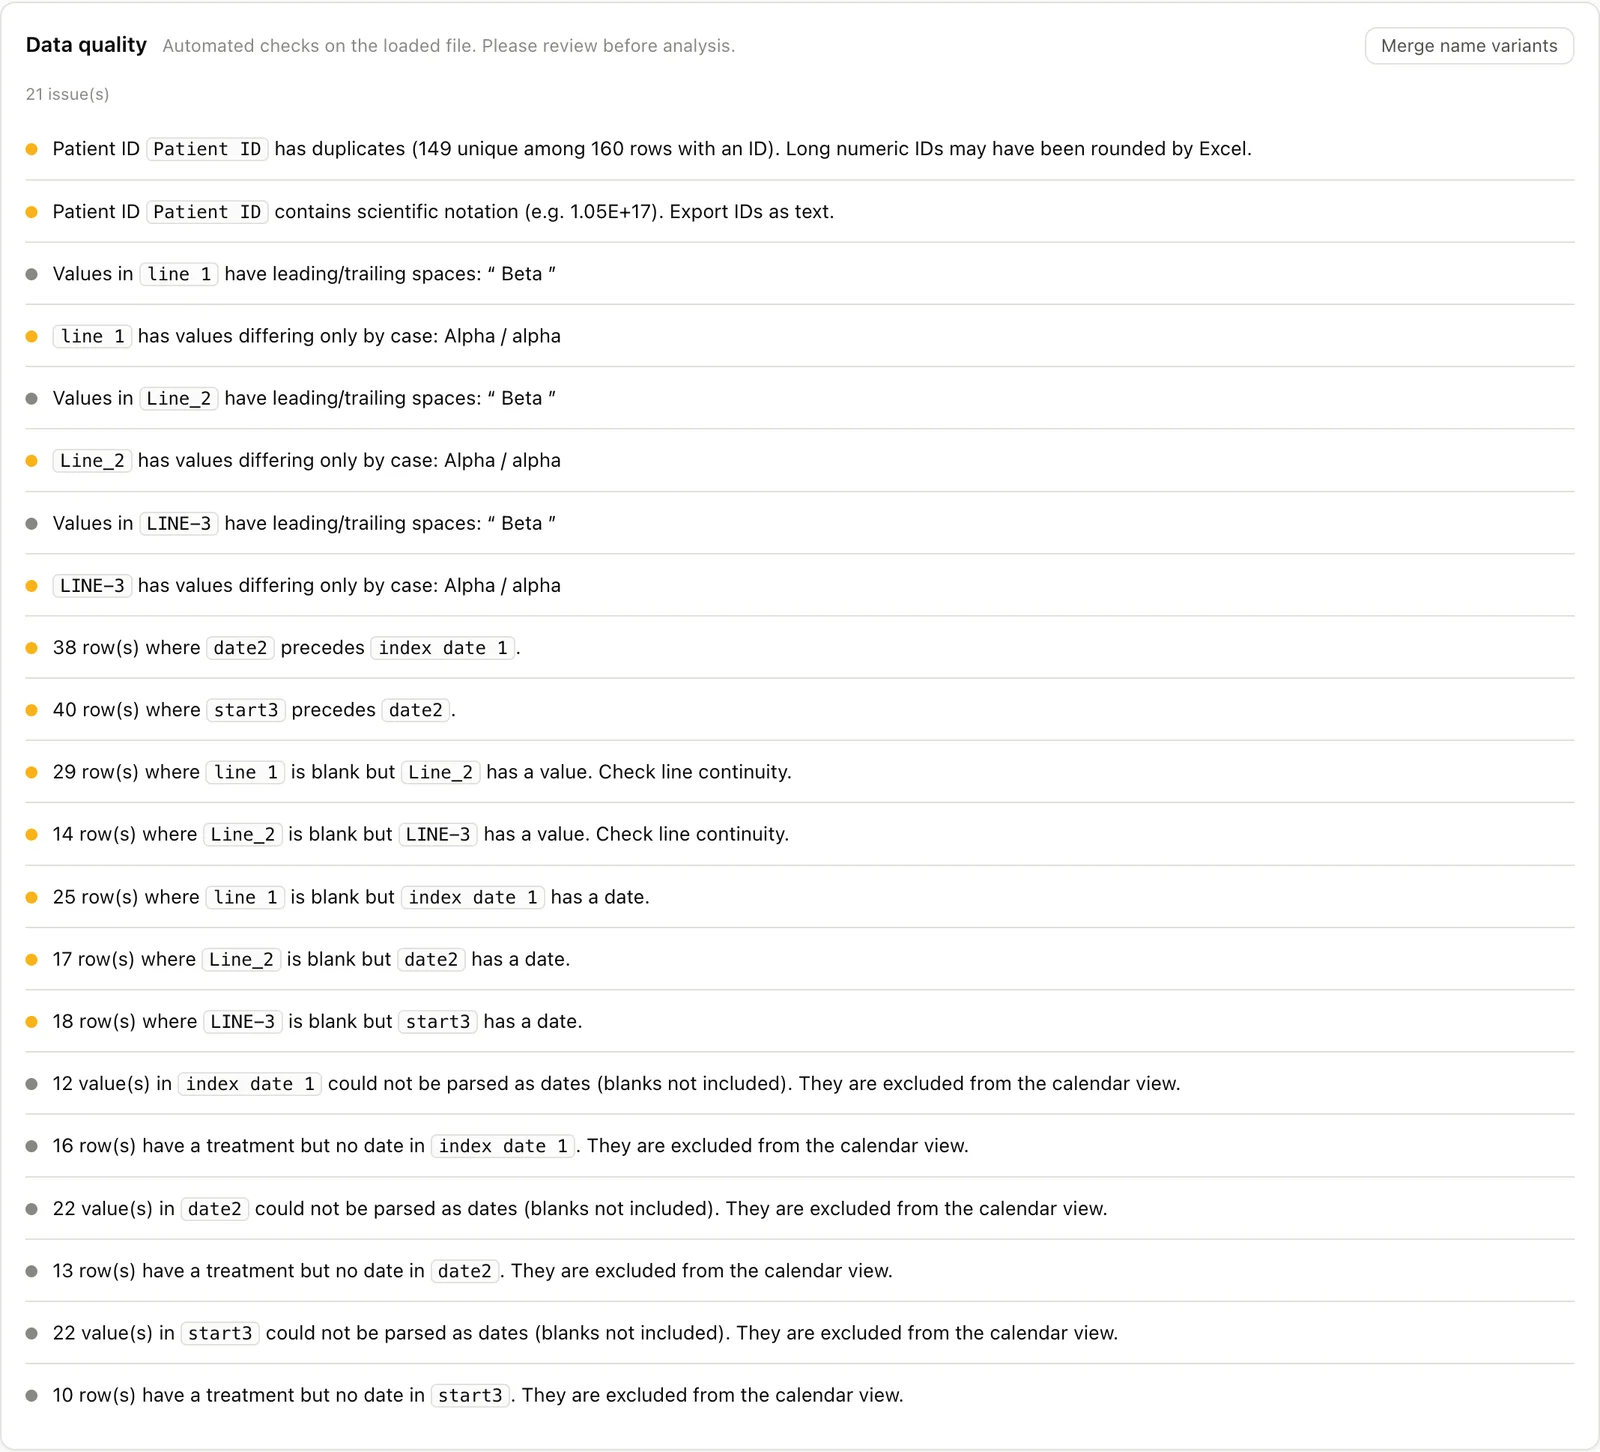
- Data quality checks: 21 warnings were raised
| Warning | Count | Details |
|---|---|---|
| Duplicated patient IDs | 1 | 160 rows with an ID, but only 149 distinct IDs |
| IDs in exponential notation | 1 | There are IDs such as 1.05E+17 |
| Leading and trailing spaces | 3 | " Beta " appears in the Line 1 to 3 columns (on screen the value is wrapped in quotation marks to show the spaces) |
| Values differing only in case | 3 | Alpha and alpha in the Line 1 to 3 columns |
| Dates out of order | 2 | 38 rows where the second-line start date is earlier than the first-line one, and 40 rows where the third-line start date is earlier than the second-line one |
| Gaps between lines | 2 | 29 rows where first-line therapy is blank but second-line therapy has a value, and 14 rows where second-line is blank but third-line has a value |
| Dates without a line | 3 | Rows where the treatment name is blank but a start date is filled in: 25, 17 and 18 rows in Lines 1 to 3 |
| Values that cannot be read as dates | 3 | Values that are filled in but cannot be read as dates: 12, 22 and 22 in the start dates of Lines 1 to 3 (blanks not included) |
| Blank dates | 3 | Rows where a line has a treatment but the start date is blank: 16, 13 and 10 rows in Lines 1 to 3 |
We confirmed that even with broken input, the tool does not quietly turn it into a chart. It still draws the chart, but the warnings are listed on the “Data quality” tab, so you can see what is going on.
3-3. Checking the checks themselves
This table first had 15 warnings. A review before publication found three discrepancies in the rules for the checks.
- Leading and trailing spaces: the check looked at values after the spaces had been removed, so this warning could never appear. We changed it to check the values as loaded
- Values that cannot be read as dates: blanks were also being counted as “cannot be read”. We changed it to count only values that are filled in but cannot be read, and to report blanks separately as “blank dates”
- Duplicated patient IDs: blank IDs were included in the count. We changed it to look for duplicates only among IDs with a value, and to report blanks separately
The answers for the checks were produced by recounting from the input file with a separate program, without using the tool’s counting code. If the tool’s code were used to produce the answers, the same mistake would become part of the answers.
4. Name variants — checking rules and AI against the answers
4-1. Name variants change patient counts
The fictitious data has two pairs of facility-specific spelling differences planted in it. In the chart before merging, the same treatment is split into separate bars.
4-2. Rule-based proposals
The tool tries to normalise names with the steps below, and proposes merging names that end up in the same form.
- Unify full-width and half-width characters
- Convert to lower case
- Split into individual drugs at separator symbols (
++//・) - Remove spaces from each drug
- Sort the drugs and join them again (so that “MTX+TNFi” and “TNFi+MTX” become the same)
The name to keep is the spelling with the highest count.
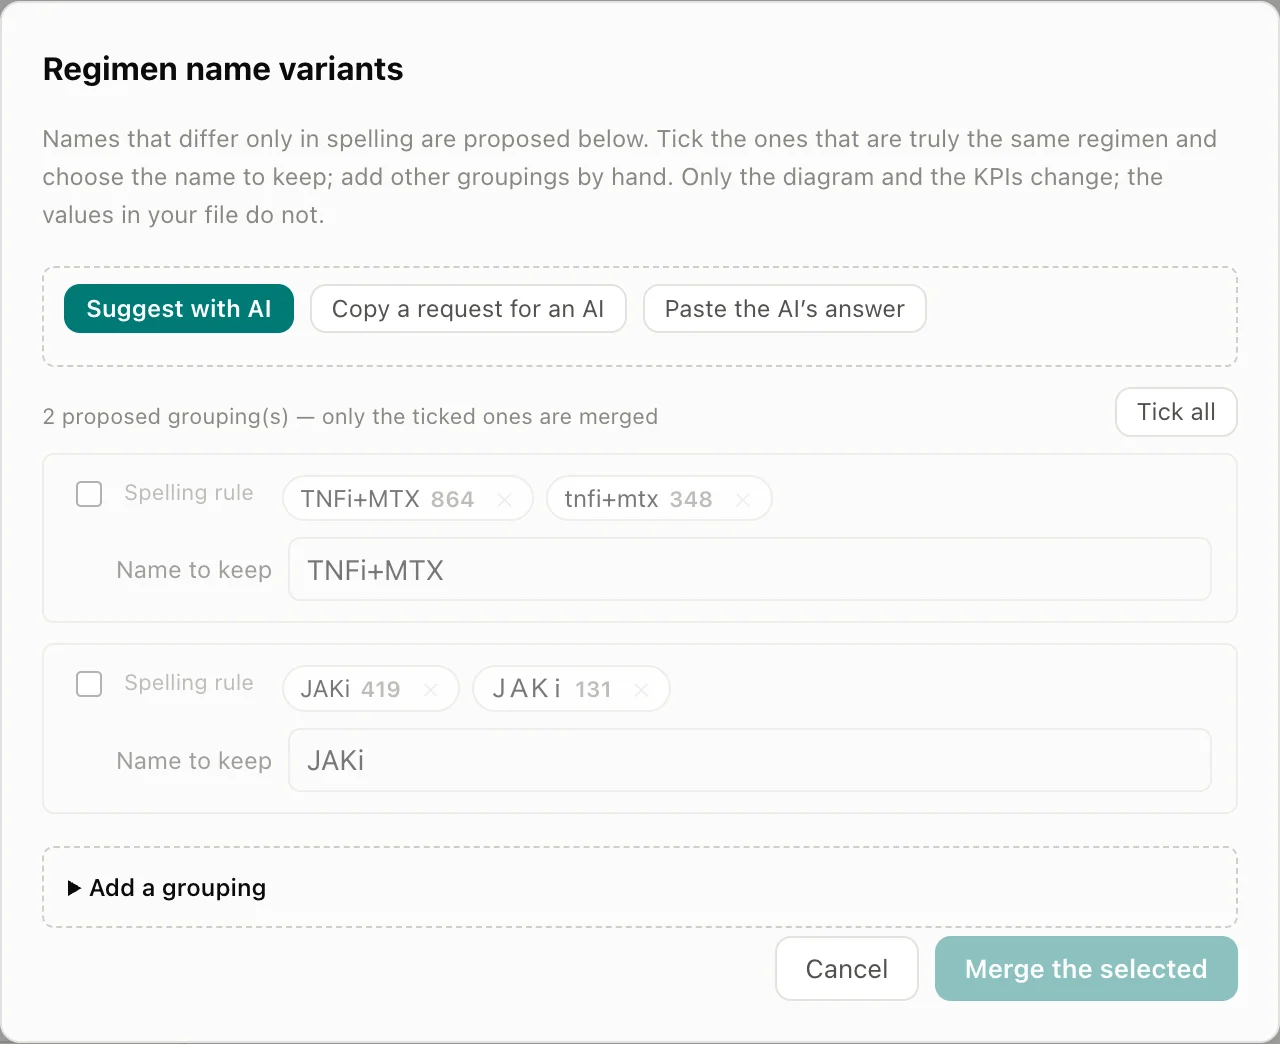
On the fictitious data, the proposals matched the two planted pairs exactly. No extra pairs appeared.
However, these rules only catch differences in the “shape” of the spelling. They do not catch the presence or absence of a hyphen, an abbreviation versus the full name (“MTX” and “methotrexate”), Japanese versus English, or typing mistakes.
4-3. AI proposals
For differences the rules cannot catch, you can also ask an AI for merge proposals. What the AI receives is only the regimen names and their counts (in the public edition, only for the fictitious data; see Part 4 (coming soon) for details).
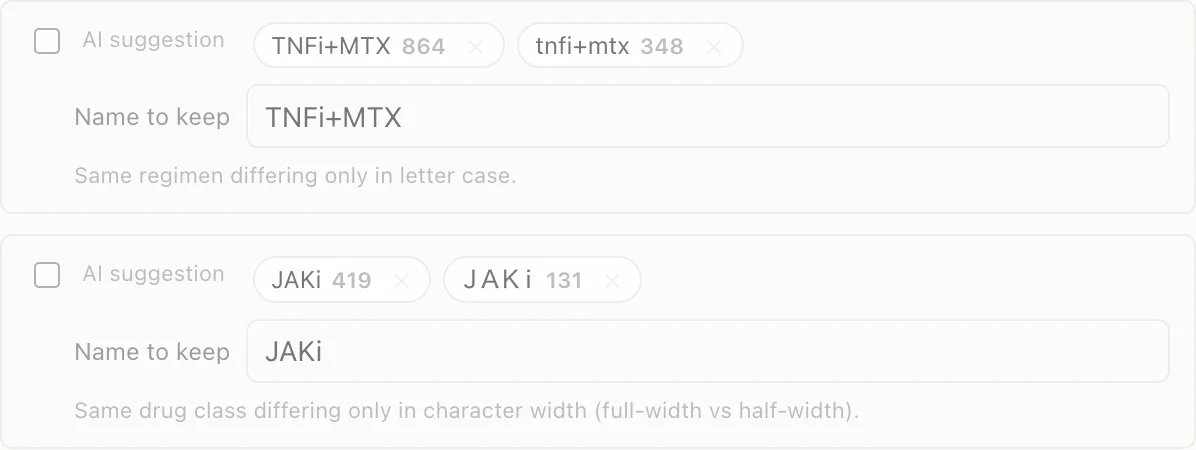
The AI’s answers are not always the same. So for column mapping and for name variants, we called the AI five times each on the fictitious data and checked the results against the answers (no answers were reused; the AI was called every time).
| Request | Runs | Matched the answers | Time per run | Cost per run |
|---|---|---|---|---|
| Column mapping (lines, start dates, patient ID) | 5 | 5 | 3.4–4.2 s | about 0.1 yen |
| Merging name variants | 5 | 5 | 1.1–1.4 s | about 0.03 yen |
All 10 runs were correct. For column mapping, the AI got all of the lines, start dates and patient ID right; for name variants, it returned only the two planted pairs and no extra ones.
4-4. After merging
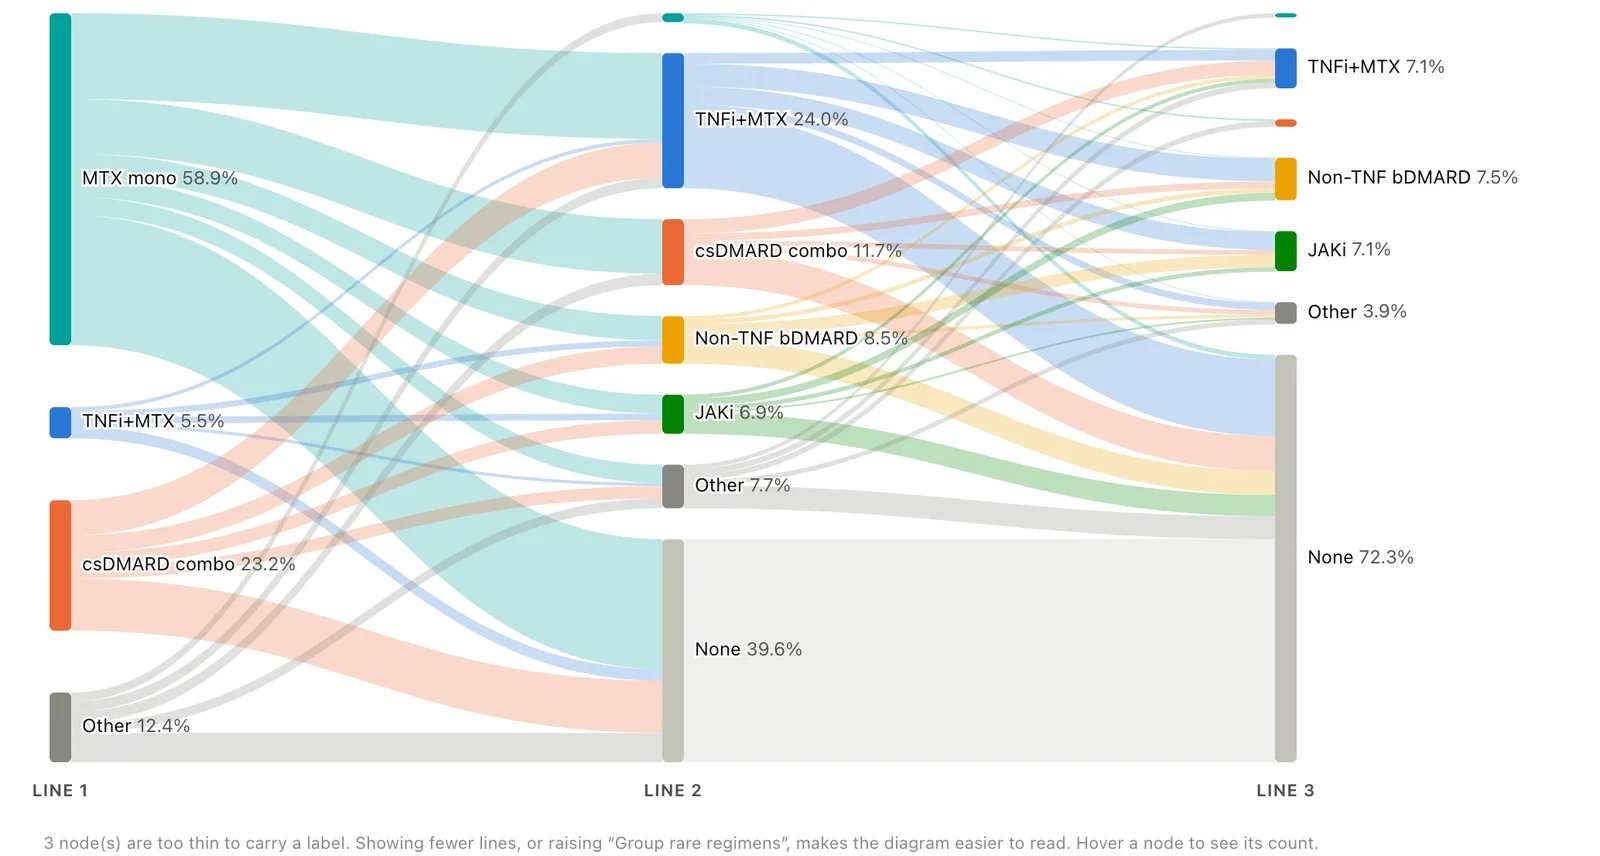
When you select the proposals and merge them, each treatment becomes a single bar and the patient counts match the answers (the comparison in section 2 is done in this state). Merging affects only the chart and the numbers; it does not change the values in the loaded file. “Undo the merges” puts things back.
5. Size — speed on 100,000 rows
Real data can be much larger than 3,000 patients. So we repeated the rows of the fictitious data, assigned new patient IDs, created a 100,000-row (14.7 MB) file and measured it.
| Process | Time (5 runs) |
|---|---|
| Loading and checking | 912–950 ms |
| Counting (default settings) | 52–67 ms |
| Counting (up to Line 5) | 83–98 ms |
Counting is the process that runs every time you focus or change a setting. At around 50 ms, the chart changes as soon as you click.
6. What we handed to Claude Code, and what people decided
| Handed to Claude Code | Decided by people |
|---|---|
| The program that generates the fictitious data and the answer file | The disease (rheumatoid arthritis), the treatment groups, and the shape of up to Line 5 |
| Tests comparing the answers with the tool’s totals | Setting the answers before the data |
| Preparing the deliberately broken input and tests to check the behaviour | The eight ways of breaking it, especially including IDs rounded by Excel |
| Reviewing the checks, and the answers for the checks recounted by a separate program | The rules for raising warnings, such as separating blanks from “values that cannot be read” |
| Implementing the rule-based proposals | Where to draw the line between differences to catch (shape only) and differences not to catch |
| Calling the AI five times each and checking against the answers | Keeping the AI’s answers as proposals |
| Measuring the speed on 100,000 rows | What size of data to plan for |
Once written, comparisons and tests can be run any number of times. Whenever we rebuilt the screens, added AI features or revised the rules for the checks, we could confirm each time that the totals had not changed.
7. Summary
- A chart appearing on the screen is not the same as the patient counts being correct. We checked at four levels: the whole, breakage, name variants and size
- The whole: with fictitious rheumatoid arthritis data (3,000 patients) whose answers were set first, all 145 items matched the answers
- Breakage: with deliberately broken input (160 rows), columns were matched by name and 21 warnings were raised. We also found and fixed discrepancies in the checks themselves
- Name variants: the rule-based proposals gave only the two planted pairs, and the AI was correct in all 10 runs. Even so, a person confirms
- Size: a 100,000-row file loads in about 0.9 seconds, and counting takes around 50 ms
- Setting the answers first, deciding how to break the input, and keeping the AI as a source of proposals were decided by people
If you prepare the answers first, you do not have to stop at “roughly right”. And the limits of having made the answers yourself should be written down too.
Next steps
Part 4 covers building in the AI: what to give it and what not to, how we limited it to the fictitious data in the public edition, and how to confirm that nothing is sent to the AI when you use your own files.
Sources
- The screenshots and figures on this page were produced with fictitious rheumatoid arthritis data (3,000 patients) and deliberately broken input. They have no connection with any real patients, facilities, drugs or companies