
Claude Code × Medical Application
[Claude Code] Treatment Pathways on One Page, Part 1: Loading the Data — Reading Analysis Listings As They Are

1. Introduction — data does not arrive in the shape the tool wants
Most tools that chart lines of therapy ask for a file in a fixed shape: “the first-line column has this name, the second-line column has that name.” What actually lands on your desk, however, is data prepared for analysis.
- For each line, columns for the group name, the individual regimen name, the start date and the end date run in a numbered series
- Column names differ from company to company and from person to person
- CSVs exported in Shift_JIS, Excel files and semicolon-delimited files are all mixed in
- Long patient IDs may have been rounded after passing through Excel once
Every time you reshape the data to fit a tool, you add work and chances for mistakes. So the Treatment Line Sankey Diagram takes a different approach: read the data in the shape it arrives, infer which column is which from the contents, and leave the final decision to a person.
This post goes through that loading mechanism step by step.
- What we wrote before handing the work to Claude Code
- Reading numbered columns from their “contents”
- Column mapping — the inference is a proposal; a person confirms it
- Absorbing differences in character encoding and delimiter
- Reading Excel in the browser
- Reporting problems in the data as soon as it is loaded
- What this mechanism cannot read
- 34columnsthe number of columns in the fictitious data used in the series (3,000 patients, up to Line 5)
- 5familiesgroups of numbered columns found in the fictitious data
- 3typescharacter encodings detected automatically (UTF-8, Shift_JIS, UTF-16)
- 0requests to anywhere outside the site while loading
2. What we wrote before handing the work to Claude Code
2-1. The instructions
We left the implementation to Claude Code, but before starting, we wrote down in an instruction document what to build and what to protect. The parts that concern loading were as follows.
| Item | What we wrote |
|---|---|
| Purpose | Load analysis listings without modifying them, and turn them into a chart |
| Input format | CSV and Excel (.xlsx). Do not fix the column names. Assume a layout in which the columns for each line run in a numbered series |
| What to protect | Never send the loaded file anywhere. Keep components to the minimum needed, and use only ones that make no network requests. Use no real drug product names or company names |
| How to verify | Prepare answer-keyed fictitious data and deliberately broken input, and confirm that both can be read |
| Where to stop | Write a report and stop at each stage. Move on only after a person has made a decision |
2-2. What people decided
The most important decision was that the inference stays a proposal, and a person confirms it.
Since column names differ from company to company, any rule will sometimes get it wrong. If a wrong inference goes straight into a chart, the wrong numbers take on a life of their own without anyone noticing. So we set the order at the outset: always show the result of the inference on screen, show what it was based on, and draw the chart only after a person has checked it.
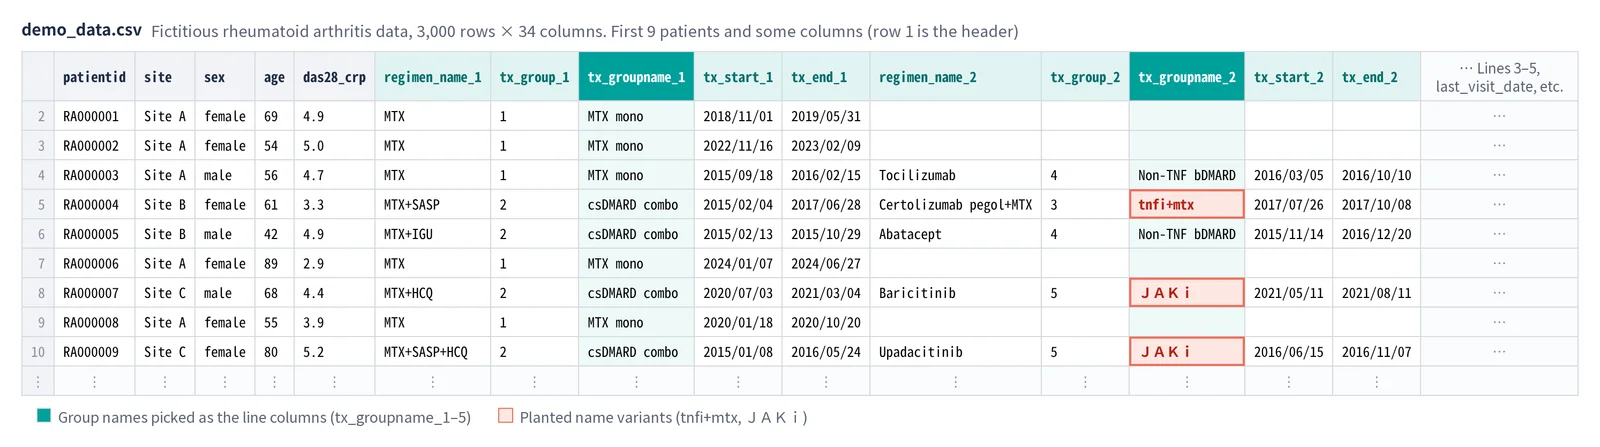
The other decision was to make the fictitious data deliberately “untidy”. The fictitious data built into the tool uses analysis-style column names such as tx_groupname_1, and also includes individual regimen names, sort-code columns, and columns for site and lab values, for 34 columns in all. A tool that works on tidy data will not necessarily work on real files.
3. Reading numbered columns from their “contents”
3-1. First, split into “families”
Column names differ between companies, but analysis listings have something in common: groups of columns that share a stem and carry the numbers 1, 2, 3 …. The tool calls these “families”.
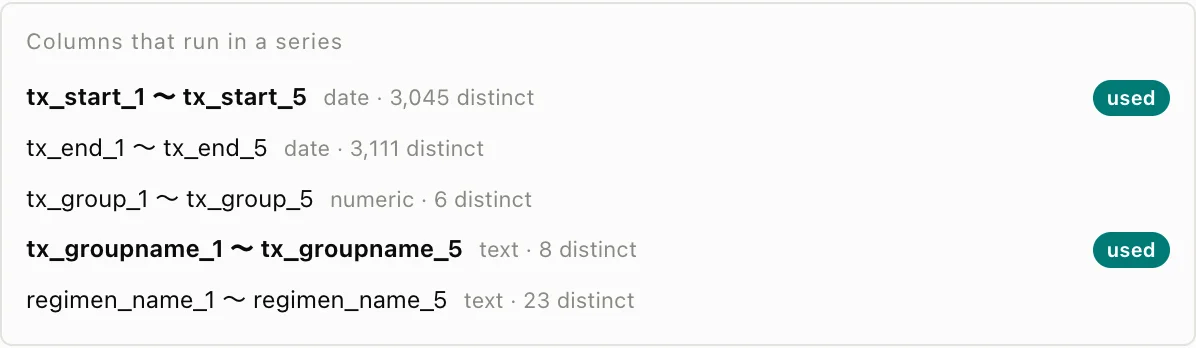
tx_groupname_1totx_groupname_5tx_start_1totx_start_5regimen_name_1toregimen_name_5
Columns are split into families by the number at the end of the column name, and only families whose numbers run from 1 without a gap become candidates.
3-2. For each family, count the type and the number of distinct values
Next, the tool looks at the contents of each family.
- Type: if 90% or more of the values can be read as dates, “date”; if as numbers, “numeric”; otherwise “text”
- Number of distinct values: how many different values the family contains
3-3. Choosing with two rules
Once the columns are split into families and typed, only a few candidates remain, and two simple rules are enough to choose.
| What to choose | Rule | Reason |
|---|---|---|
| Line (regimen) columns | Among text families, the one with the fewest distinct values | Too many values means too many nodes in the chart to read. Given group names (8 values) and individual regimen names (23 values), the group names suit the chart better |
| Start date columns | Among date families, the one that holds the earliest date row by row | Start and end dates have the same date type. Compared row by row, the earlier one is always the start date |
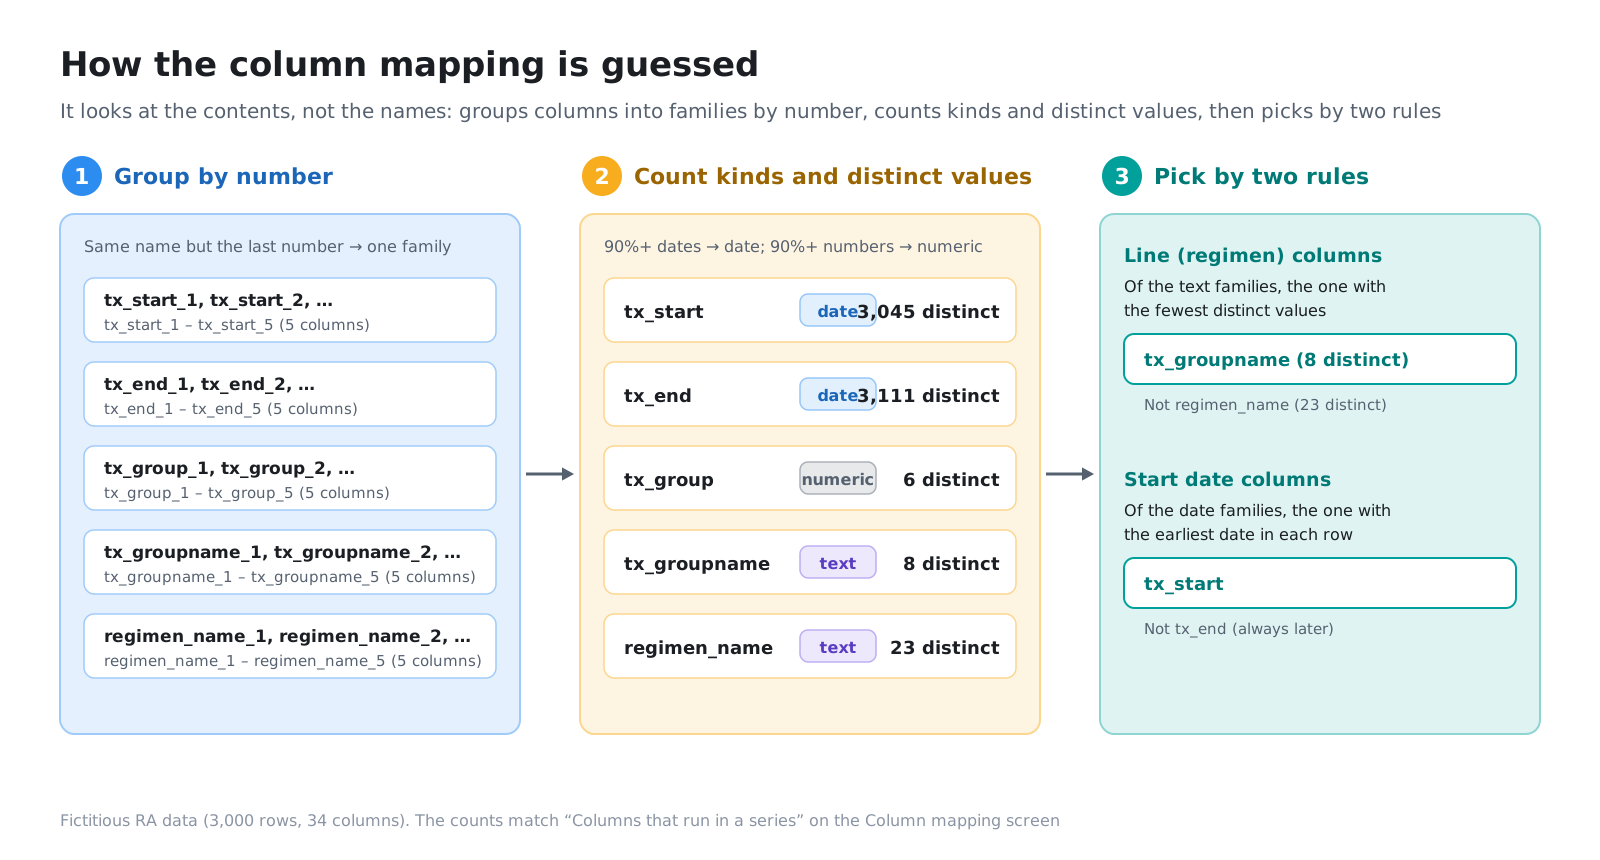
Both rules look at the contents, not the column names. Whether the name is line_1, tx_groupname_1 or 治療群1, the choice works the same way.
4. Column mapping — the inference is a proposal; a person confirms it
The result of the inference opens already filled in on the Column mapping screen. The tool does not jump straight to a chart.
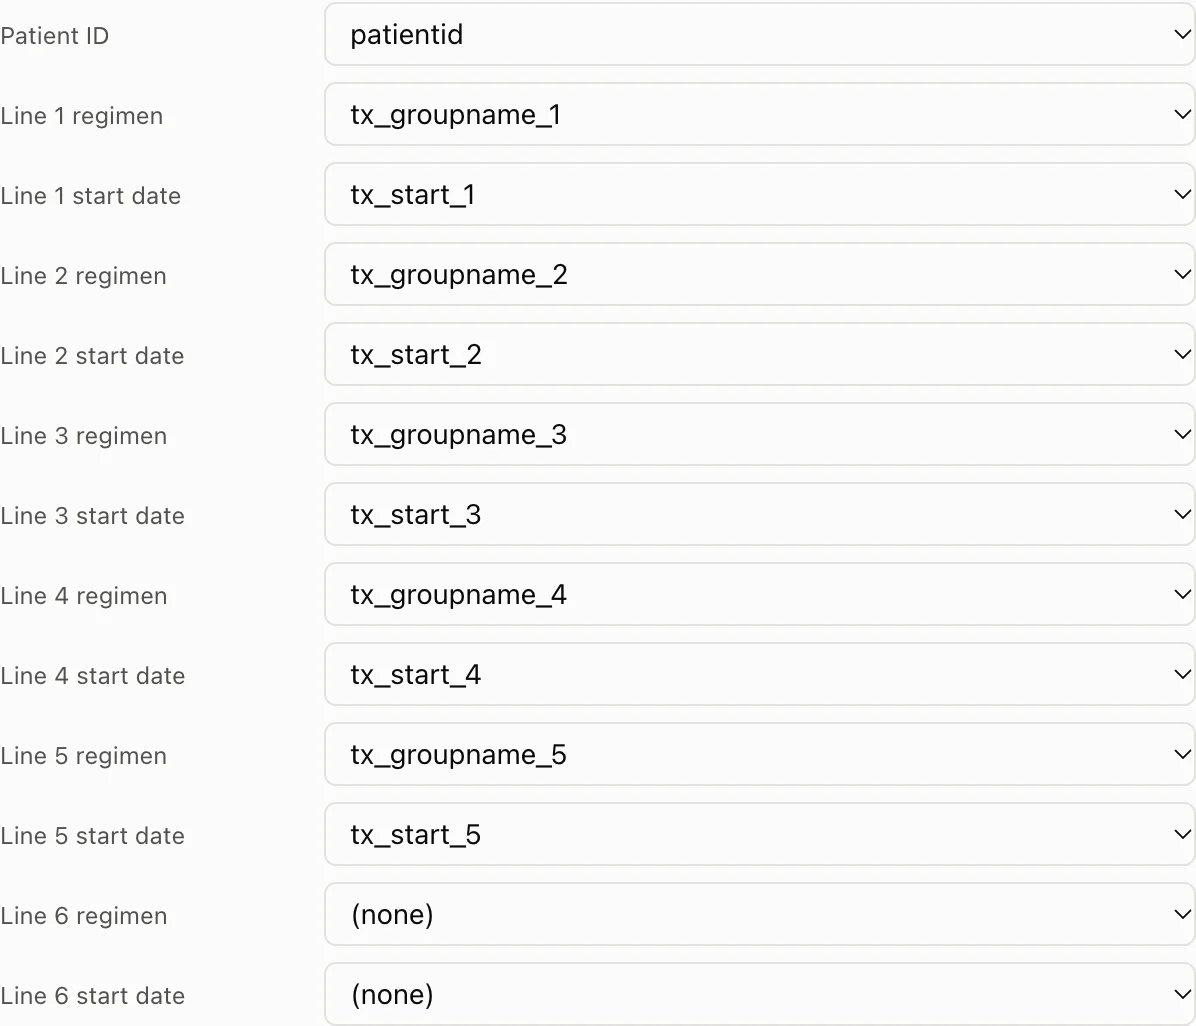
- You can see in one list which families were candidates and which were chosen
- If something is wrong, you can choose again for each line
- No chart is drawn until you press “Apply”
Whether the inference is right or wrong, a person looks at it once before it becomes a chart. This one extra step stops a chart built on a wrong mapping from taking on a life of its own.
You can also ask an AI to propose the column mapping (in the public edition, only with fictitious data). What is passed to the AI, and how it is checked, is covered in Part 4 (coming soon).
5. Absorbing differences in character encoding and delimiter
5-1. Trying character encodings in turn
CSVs produced in Japan are not always UTF-8. Files exported from older systems are often Shift_JIS (CP932), and some are UTF-16.
The tool tries, in the following order, whether “every byte can be read correctly in this character encoding”.
- UTF-8 (with or without a byte order mark (BOM) at the start)
- Shift_JIS (CP932)
- UTF-16 (readable even without a BOM)
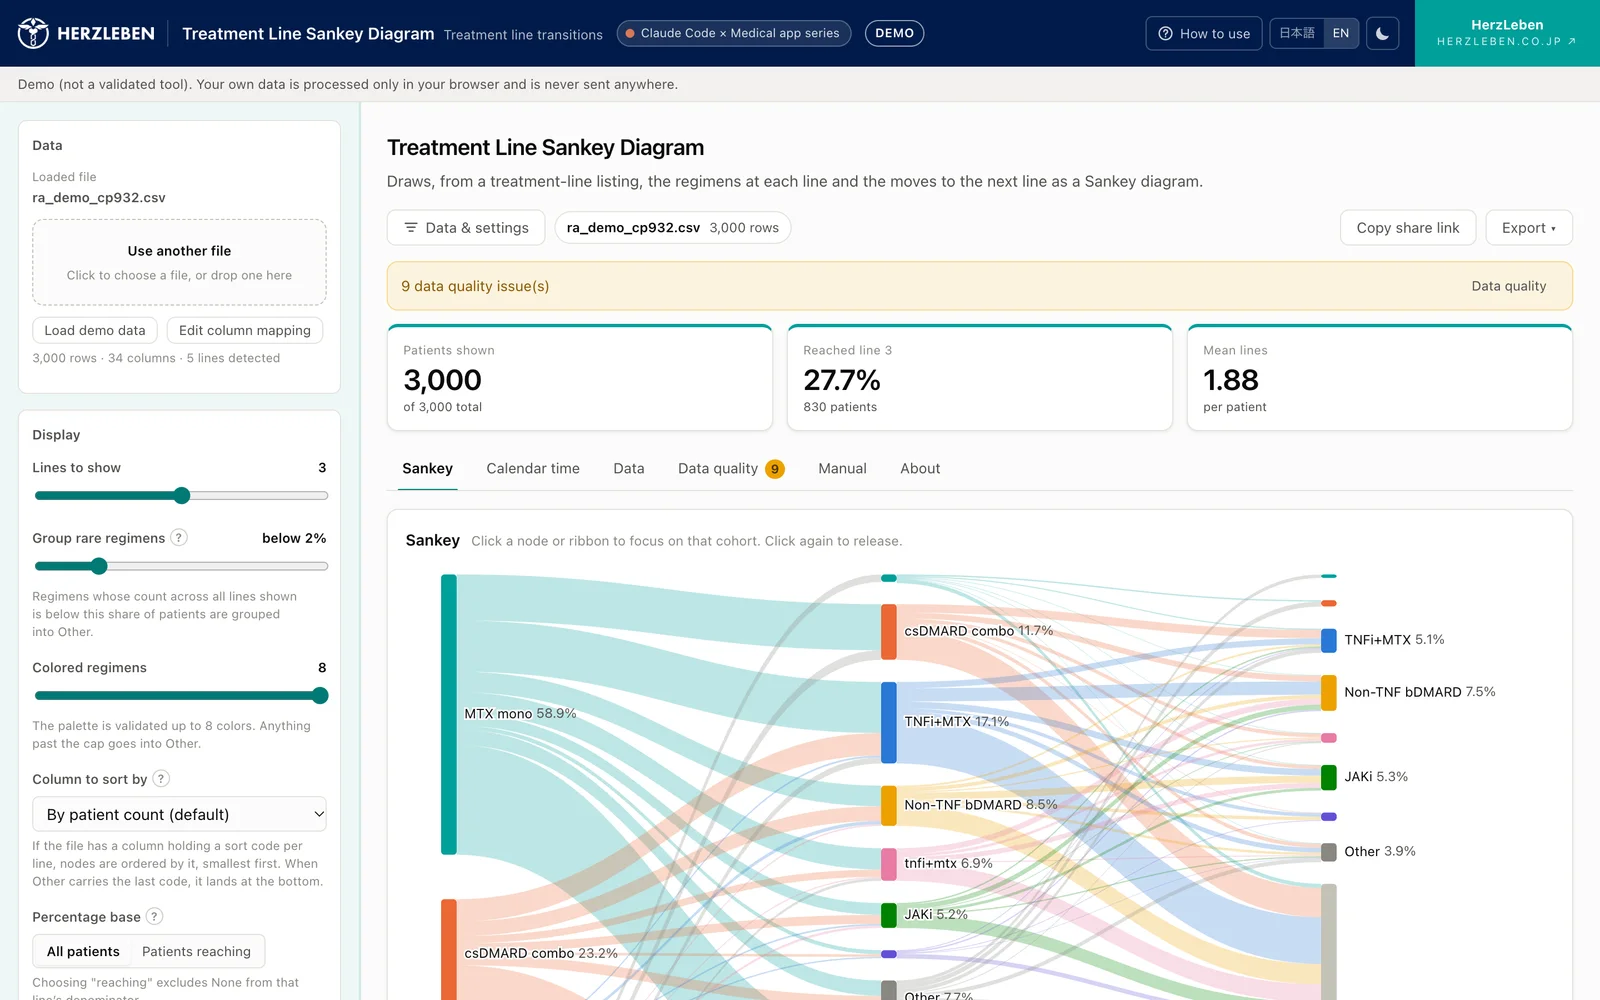
If none of them works, the tool stops instead of carrying on with garbled text, and tells you that the character encoding could not be determined, and which encoding to re-save the file in. A file that is genuinely empty (0 bytes, or whitespace only) gets a separate message.

5-2. Inferring the delimiter
The delimiter is not always a comma either. Some files use semicolons or tabs. The tool looks at the first rows to infer the delimiter. Delimiters and line breaks inside quotation marks are not treated as delimiters.
6. Reading Excel in the browser
Analysis results sometimes arrive as Excel files. An Excel (.xlsx) file is a compressed bundle of XML for the tables. The Treatment Line Sankey Diagram unpacks and reads it inside the browser.
- Decompression uses just one small component with no dependencies (fflate). It makes no network requests
- The table XML is read by the tool’s own code
- Only the first sheet is read. For formulas, the stored values are read
- Cells formatted as dates are read as dates, and integers as integers (“74” does not become “74.0”)
- Japanese date formats, such as Japanese era years or “2020年1月5日”, are also read as dates
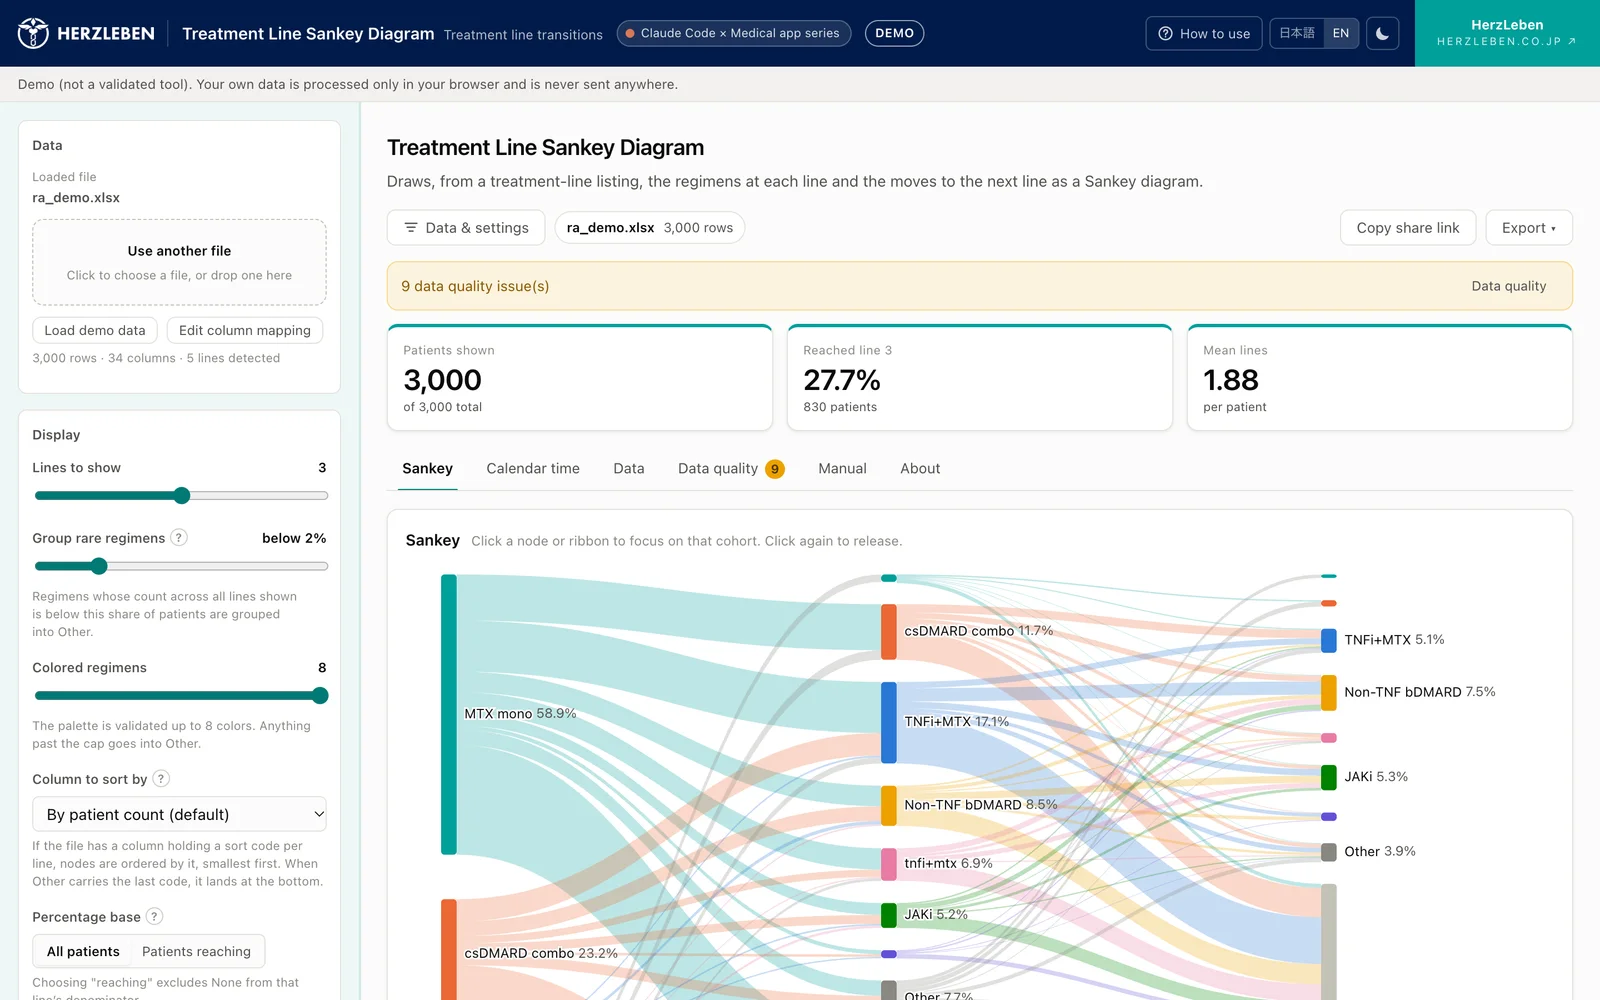
There were several widely used components for reading Excel. We avoided, however, those whose latest version is available only from the distributor’s own site, and those that depend on many other components. Because the tool never lets a loaded file leave the computer, we had decided that the components themselves must also make no network requests and be easy to see through.
7. Reporting problems in the data as soon as it is loaded
Being able to load the data does not mean the data is correct. As soon as the data is loaded, the Treatment Line Sankey Diagram checks the following points and lists them on the Data quality tab.
| What is checked | What is happening |
|---|---|
| Duplicate patient IDs | The same patient appears on two or more rows. Often long numeric IDs were rounded by Excel. Duplicates are counted only among IDs that have a value |
| Blank patient IDs | Some rows have an empty ID. Reported separately from duplicates |
| IDs in exponential notation | IDs such as 1.05E+17. The CSV was not exported with the ID as text |
| Leading or trailing spaces | Values with spaces before or after them, such as " Beta ". On screen, the value is shown in quotation marks so the spaces are visible |
| Differences only in case or full-width/half-width characters | TNFi+MTX and tnfi+mtx, or JAKi and JAKi, are counted as different treatments |
| Date order | The second-line start date is earlier than the first-line start date |
| Gaps in lines | First-line therapy is blank, but second-line therapy has a value |
| Dates without a line | The treatment name is blank, but a start date is filled in |
| Values that cannot be read as dates | A date column contains text that is not a date (blanks are not included) |
| Blank dates | A line has a treatment, but its start date is blank |
| Line 0 columns | There is a column such as line0. The tool reports that it is not used in the chart |
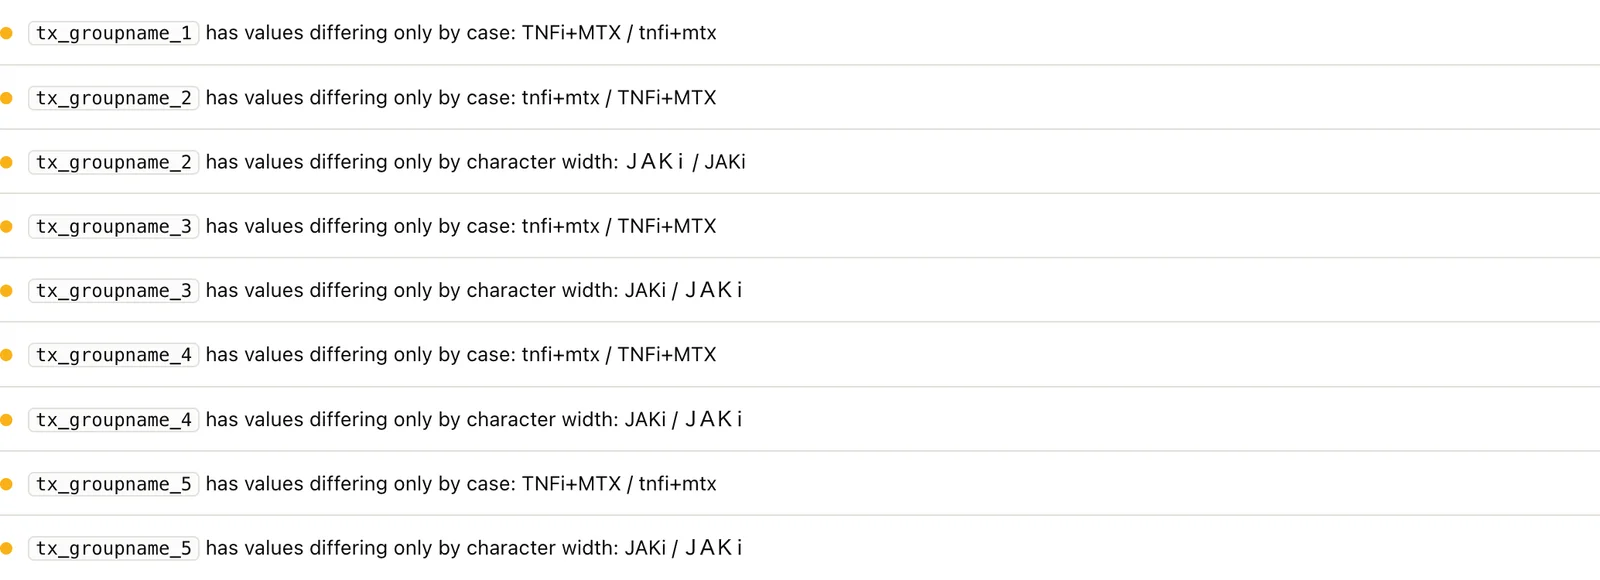
The deliberately broken input looks like this.
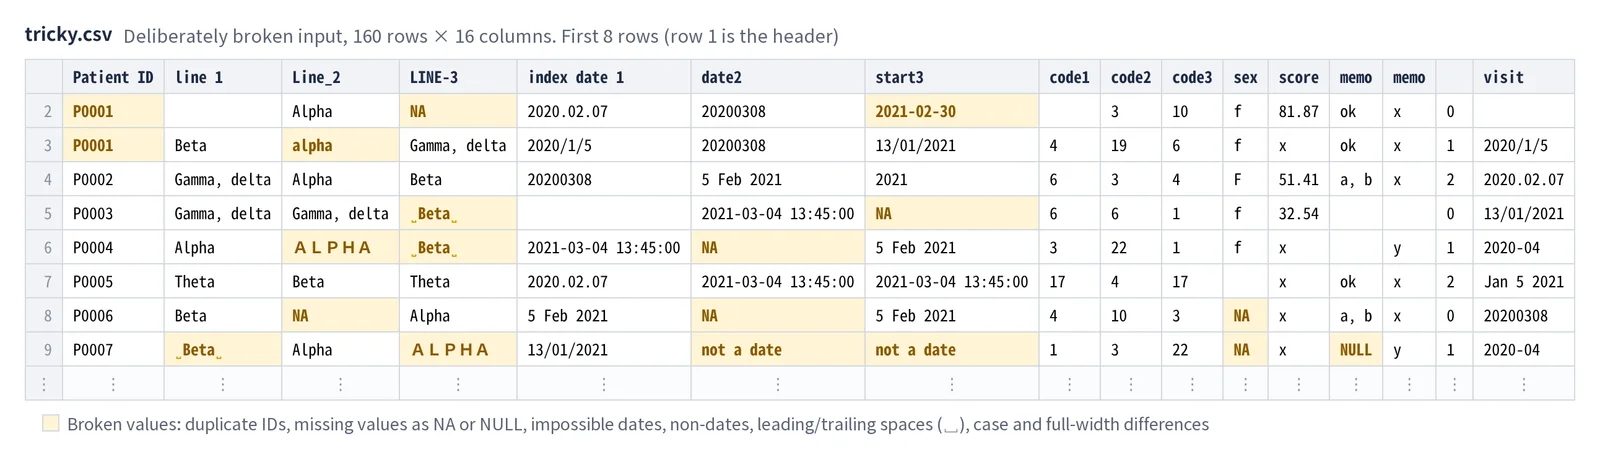
Loading the deliberately broken input (160 rows, 16 columns) produced 21 warnings. For example, there were only 149 distinct patient IDs across the 160 rows that have an ID, there were IDs such as 1.05E+17, and there were 38 rows where the second-line start date was earlier than the first-line start date.
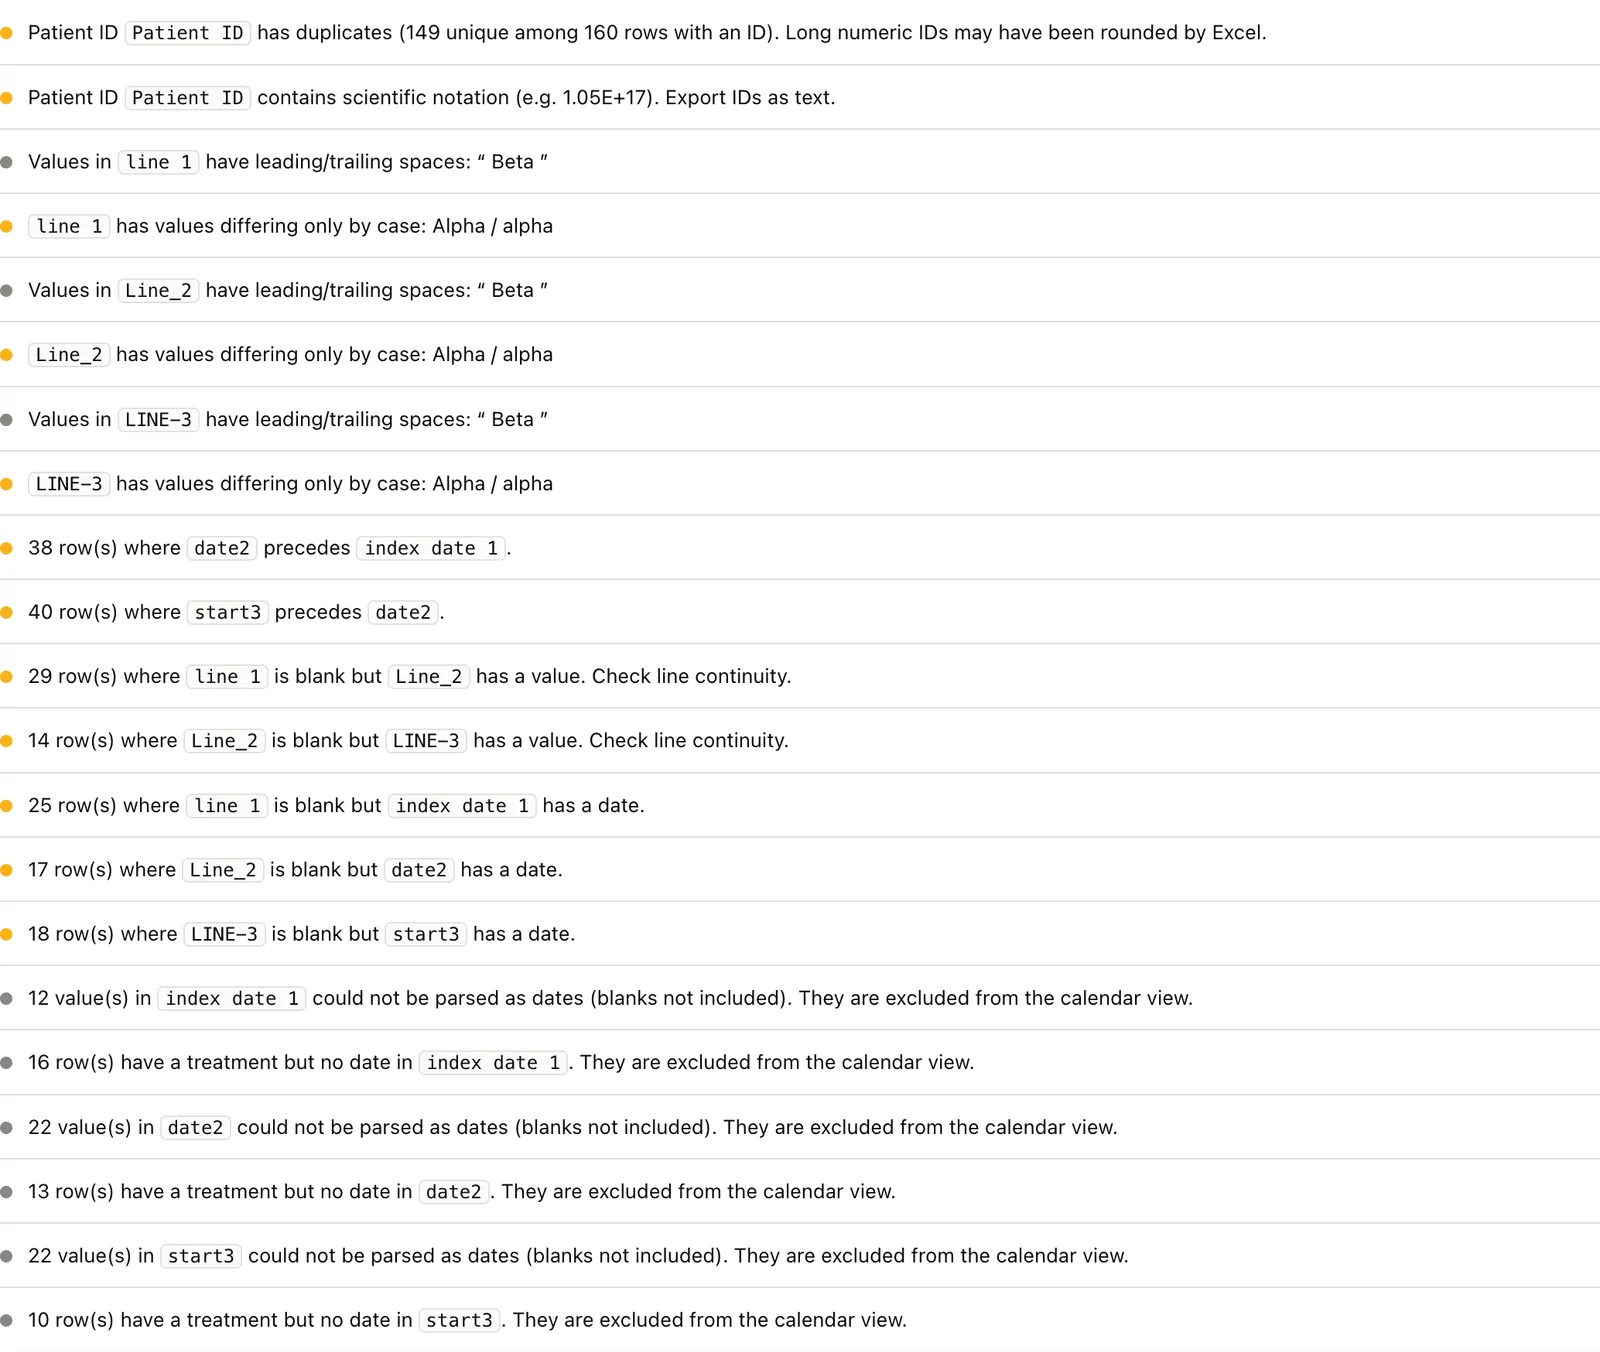
None of these can be spotted by looking at the chart alone. Duplicate IDs and name variants change the patient counts in the chart itself. The tool is designed so that you look here first, before looking at the chart. How we verified the checks themselves, and how name variants are merged, is covered in Part 3.
8. What this mechanism cannot read
| Case | What happens |
|---|---|
| Lines are not in numbered columns (“long” data, with one prescription per row) | No families are found, so nothing can be inferred. Load the data after converting it into a shape in which the lines have already been defined |
| No group-name column, only individual regimen names | The text family with the fewest distinct values is chosen, so the chart has many nodes. Choose again in the column mapping, or create a group-name column |
| Start and end dates cannot be told apart (both contain the same dates) | The start date inference may be wrong. Check it in the column mapping |
| An encoding that cannot be determined (EUC-JP and others) | The tool stops without loading and says the encoding could not be determined. Re-save as UTF-8, Shift_JIS (CP932) or UTF-16 |
| The old Excel format (.xls), and the second and later sheets | Not read. If the first sheet is empty, the tool says so |
All of these can be noticed by looking at the result of the inference on the column mapping screen. Keeping the inference as a proposal is partly a safeguard for cases like these.
9. Summary
- Analysis data often arrives with numbered columns for each line, and column names differ from company to company
- Numbered columns are split into families, the type and number of distinct values are counted, and two rules do the inference: “the text family with the fewest distinct values is the line” and “the earliest date family is the start date”. The rules look at the contents, not the column names
- The inference goes into the column mapping screen as a proposal, with its basis shown, and the chart is drawn only after a person has checked it
- Three character encodings and the delimiter are detected automatically, and Excel is also read in the browser (including Japanese date formats). When a file cannot be read, the tool stops and says, for each reason, what to do. Only components that make no network requests are used
- As soon as the data is loaded, duplicate IDs, leading and trailing spaces, name variants, date order and blanks, gaps in lines and so on are listed
Whether the inference is right matters less than whether you can notice when it is wrong. That is why the inference is always shown as a proposal.
Next steps
Part 2 covers the design used when turning the loaded data into a chart: why the order and colours do not change when you focus, where to draw the line for grouping rare treatments into Other, and how to choose the percentage base.
Sources
- The screenshots and figures on this page come from fictitious rheumatoid arthritis data (3,000 patients) and deliberately broken input. They are not related to any real patient, site, drug or company