
Claude Code × Medical Application
[Claude Code] Treatment Pathways on One Page, Part 0: Overview and Design

1. Introduction — there are many reasons to look at treatment pathways, but charting them takes effort
How did patients move from first-line to second-line therapy? In pharmaceutical companies, there are many situations where people want to know this treatment pathway.
- Medical affairs: in which line your company’s drug is used, and what patients switch from. It also becomes a figure for congress presentations and publications
- Marketing and sales planning: how treatment pathways changed after a new drug launched
- RWE and epidemiology: before planning a study, how many patients are in each line, and whether the treatment pairs you want to compare have enough patients
- HTA and market access: what “the treatment currently used” is, as the comparator
A chart commonly used to show treatment pathways on one page is the Sankey diagram, which shows the number of patients by the width of a band. Drawing a Sankey diagram, however, takes more effort than you might expect.
In this series, we introduce the Treatment Line Sankey Diagram, a tool that turns analysis data into a Sankey diagram just by loading it and lets you focus on patient groups by clicking, together with how we developed it with Claude Code.
- 0linesof code written to draw the Sankey diagram
- About 1secondto load a file of 100,000 rows
- About 50msto aggregate after focusing by a click
- 145 / 145itemsin the fictitious data where the tool’s aggregation matched the answer file
What a line of therapy is, which data it is viewed in, and how to read a Sankey diagram and its pitfalls are covered on the reference page.
2. The usual approach — Sankey diagrams are drawn by writing code
Spreadsheet software and in-house BI tools mostly either do not offer Sankey diagrams as standard or make them hard to draw the way you want. So the process tends to look like this.
| Effort | What it involves |
|---|---|
| Writing code | Write code to draw the Sankey diagram using chart libraries in R or Python |
| Reshaping the data | Rearrange the analysis listing (one column per line) into the “from where, to where, how many” shape the chart library requires |
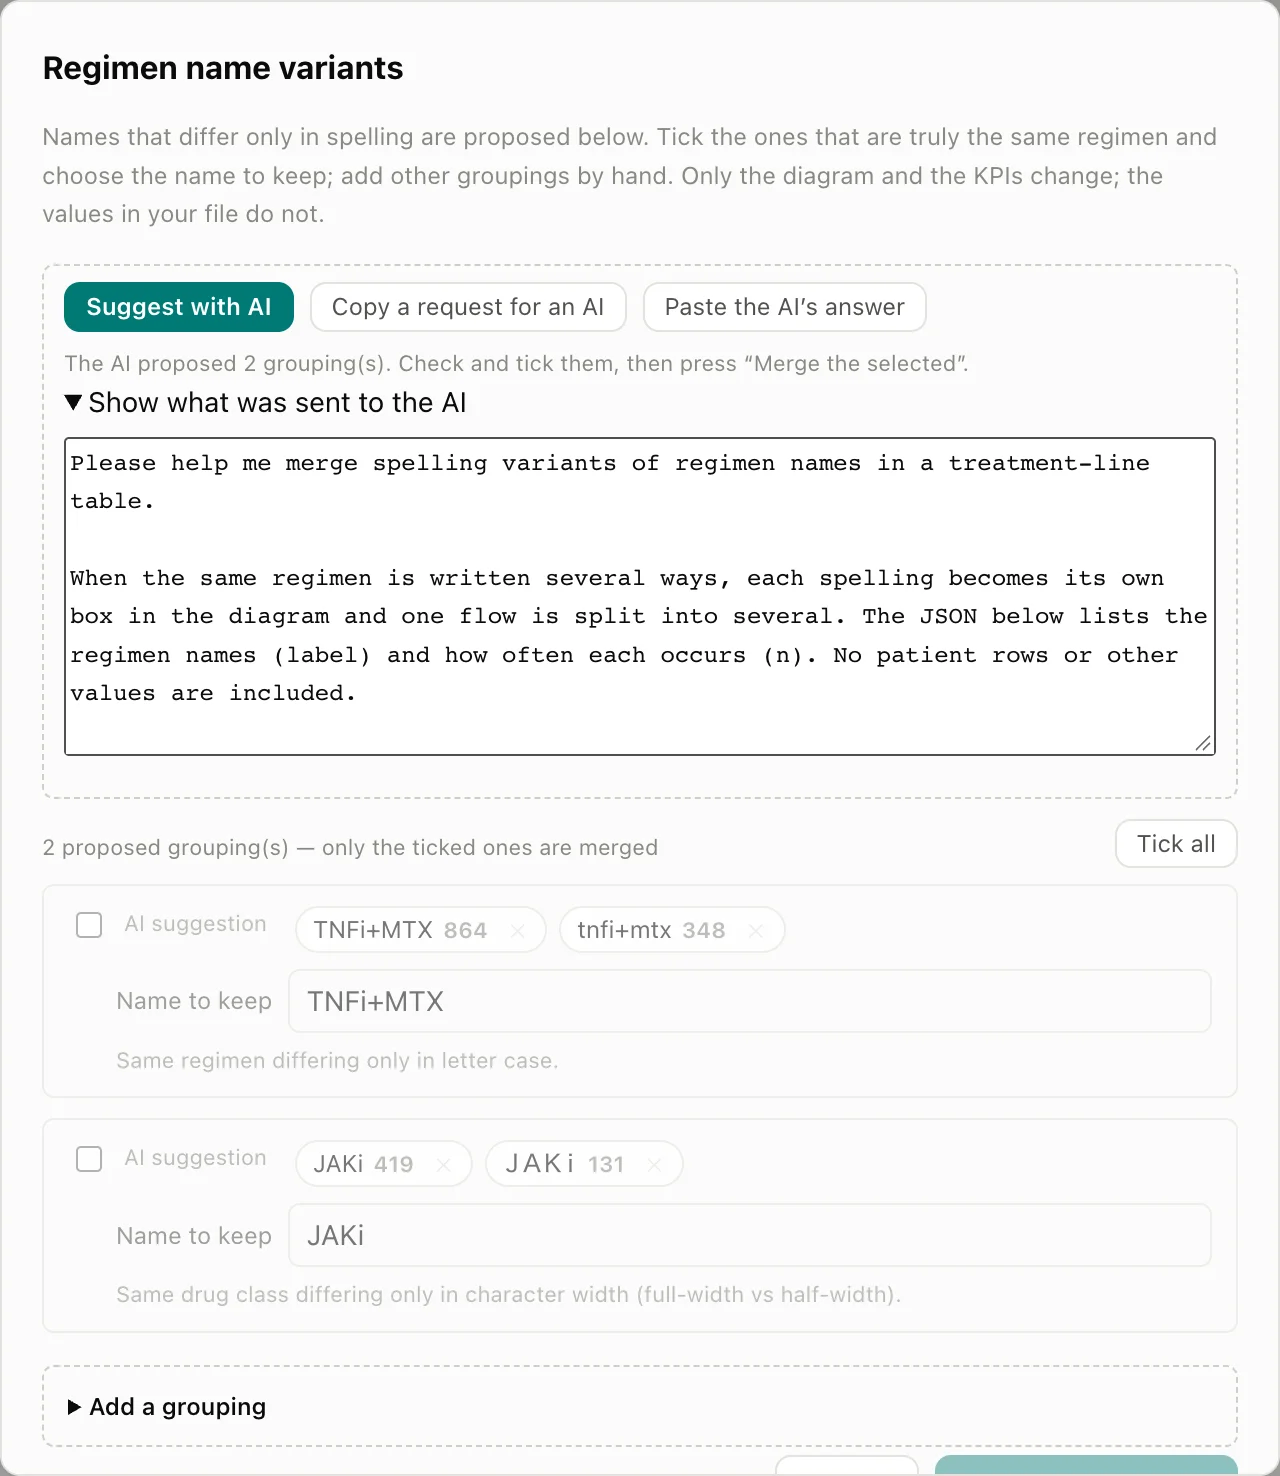
| Fixing name variants by hand | Before charting, make consistent the regimen names that each institution writes differently (TNFi+MTX and tnfi+mtx, for example) |
| Redrawing every time the conditions change | Each time you change to “only patients aged 70 or over” or “only this institution,” fix the code and redraw. Redrawing changes the order and colours of the bars, making it hard to compare with the previous chart |
As a result, charts are requested from people who can write code, and you wait every time you want to change the conditions. Even if you think “I’d like to see only the patients who moved from this treatment,” you cannot see it on the spot.
3. What the Treatment Line Sankey Diagram does
3-1. Reads analysis listings as they are
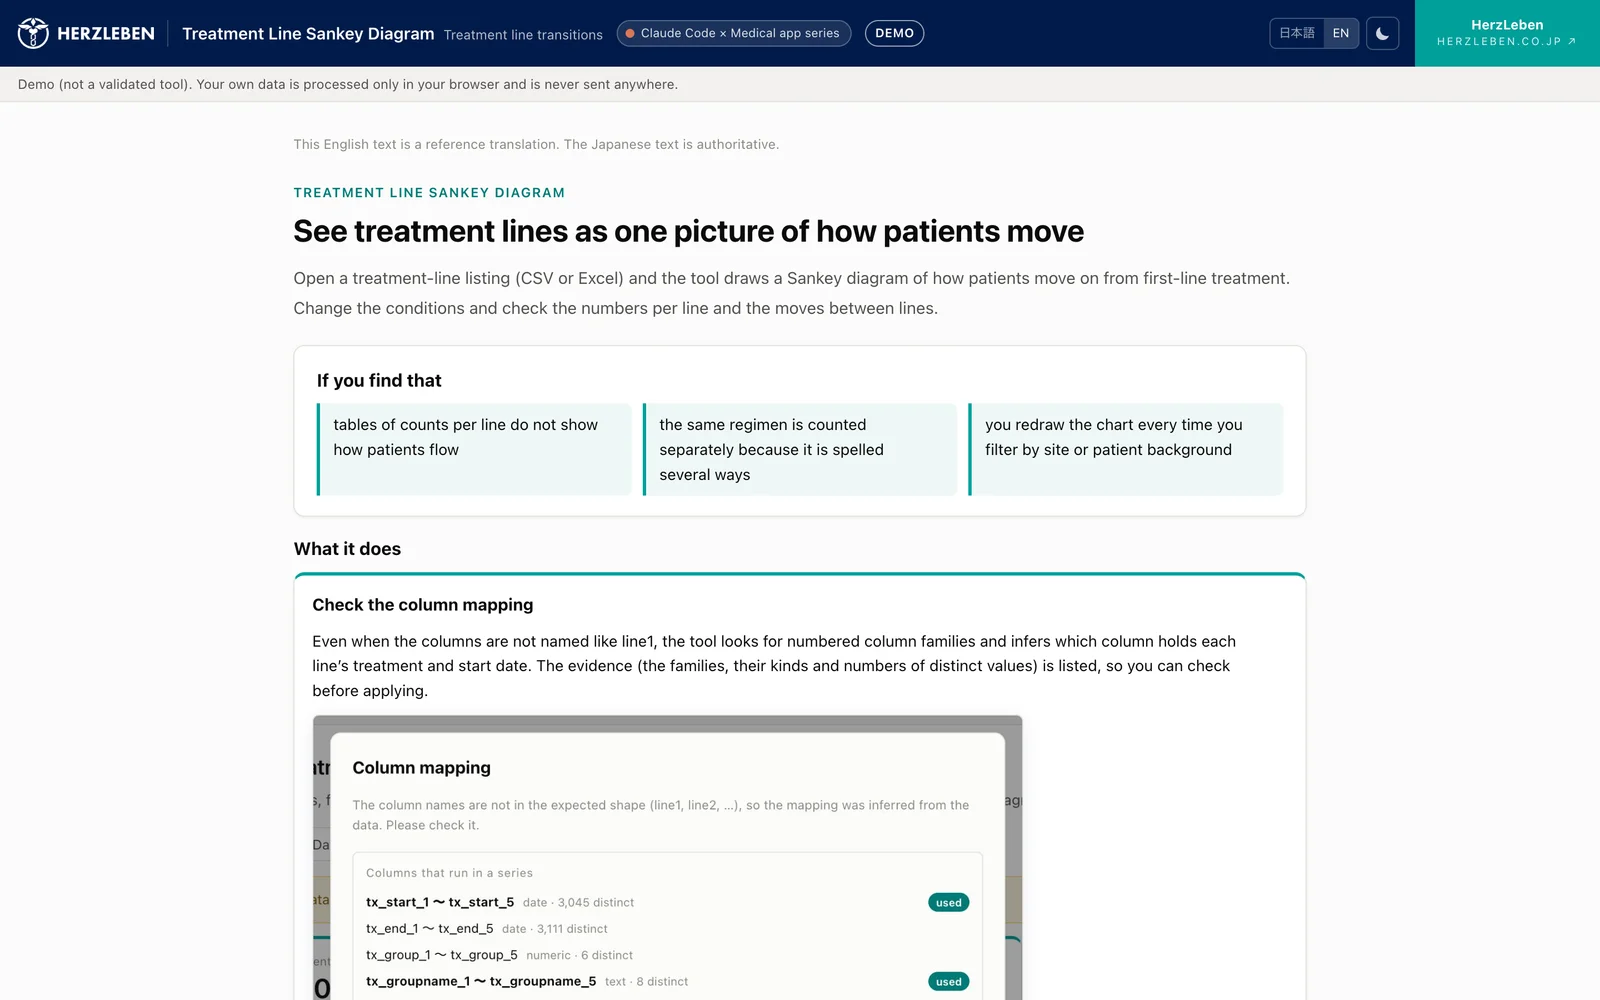
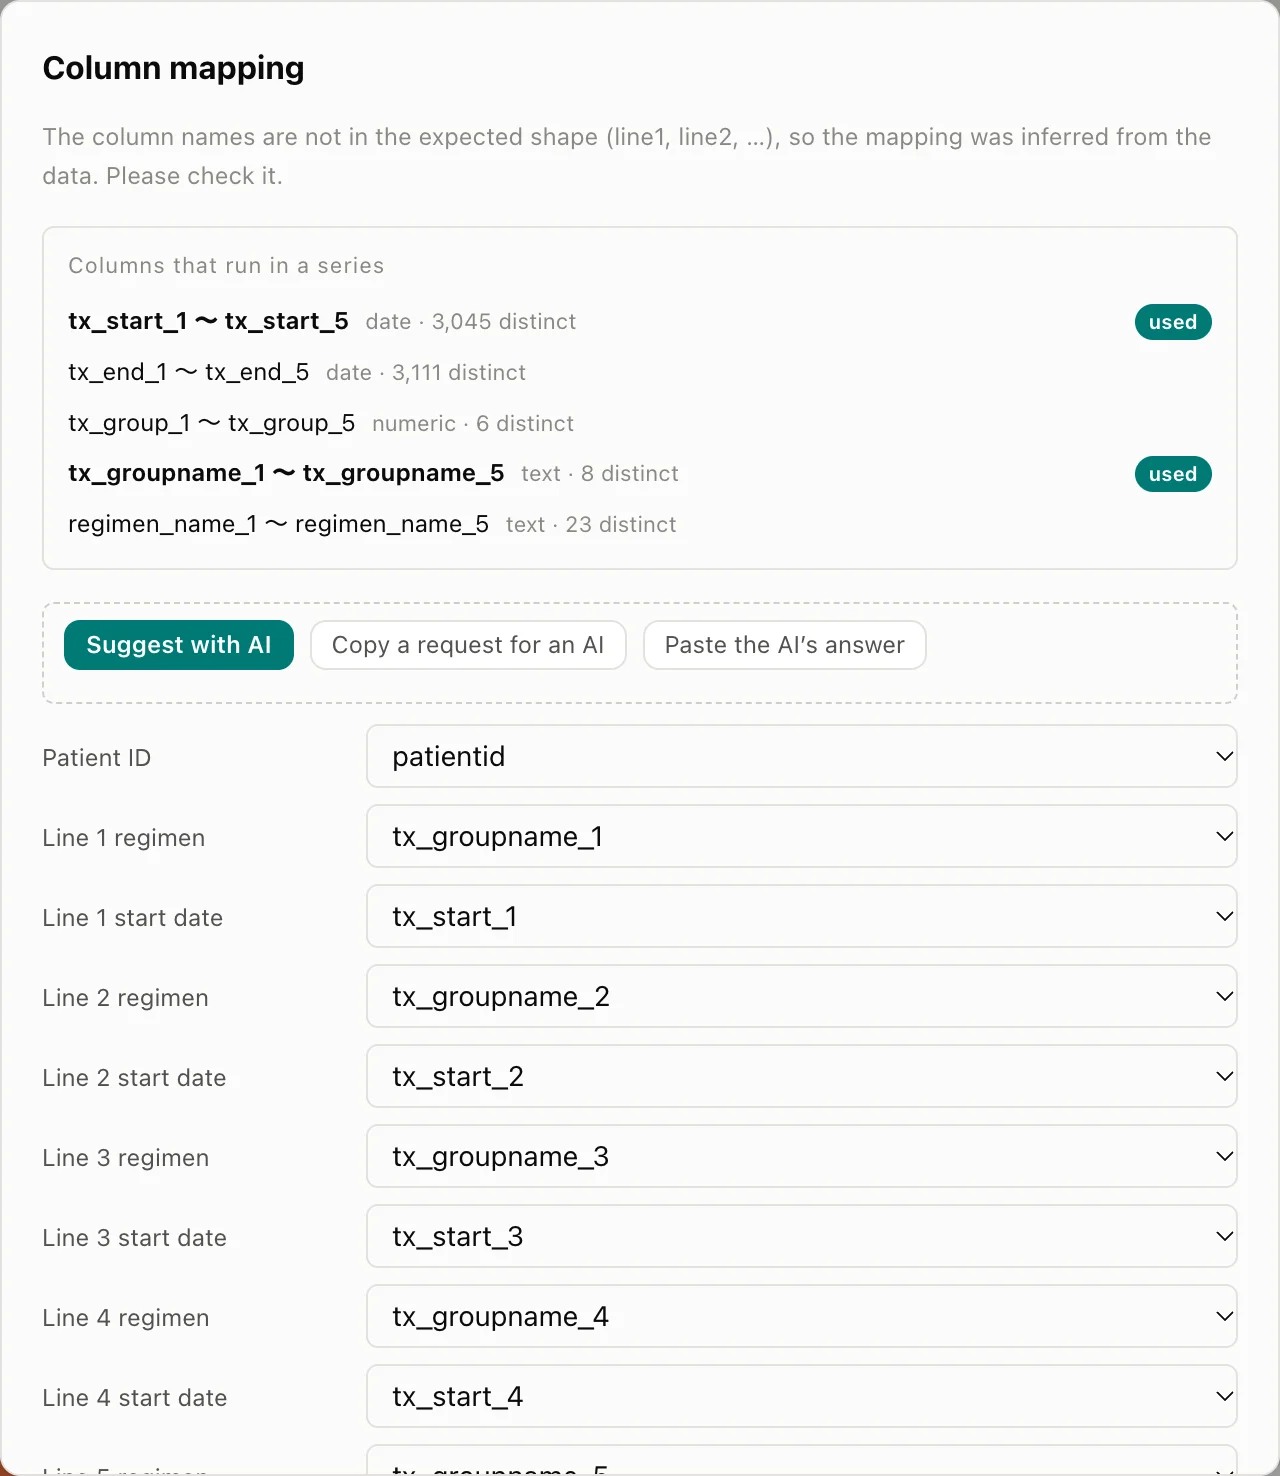
It can load data in listing form as it is, with one column per line, such as tx_groupname_1, tx_groupname_2 and so on. Whether CSV or Excel, it looks at the contents of the columns, estimates “which columns are lines and which are start dates,” and opens the column mapping with proposals filled in. It also detects the character encoding (UTF-8, Shift_JIS, UTF-16) automatically.
3-2. Focus by clicking — order and colours stay the same
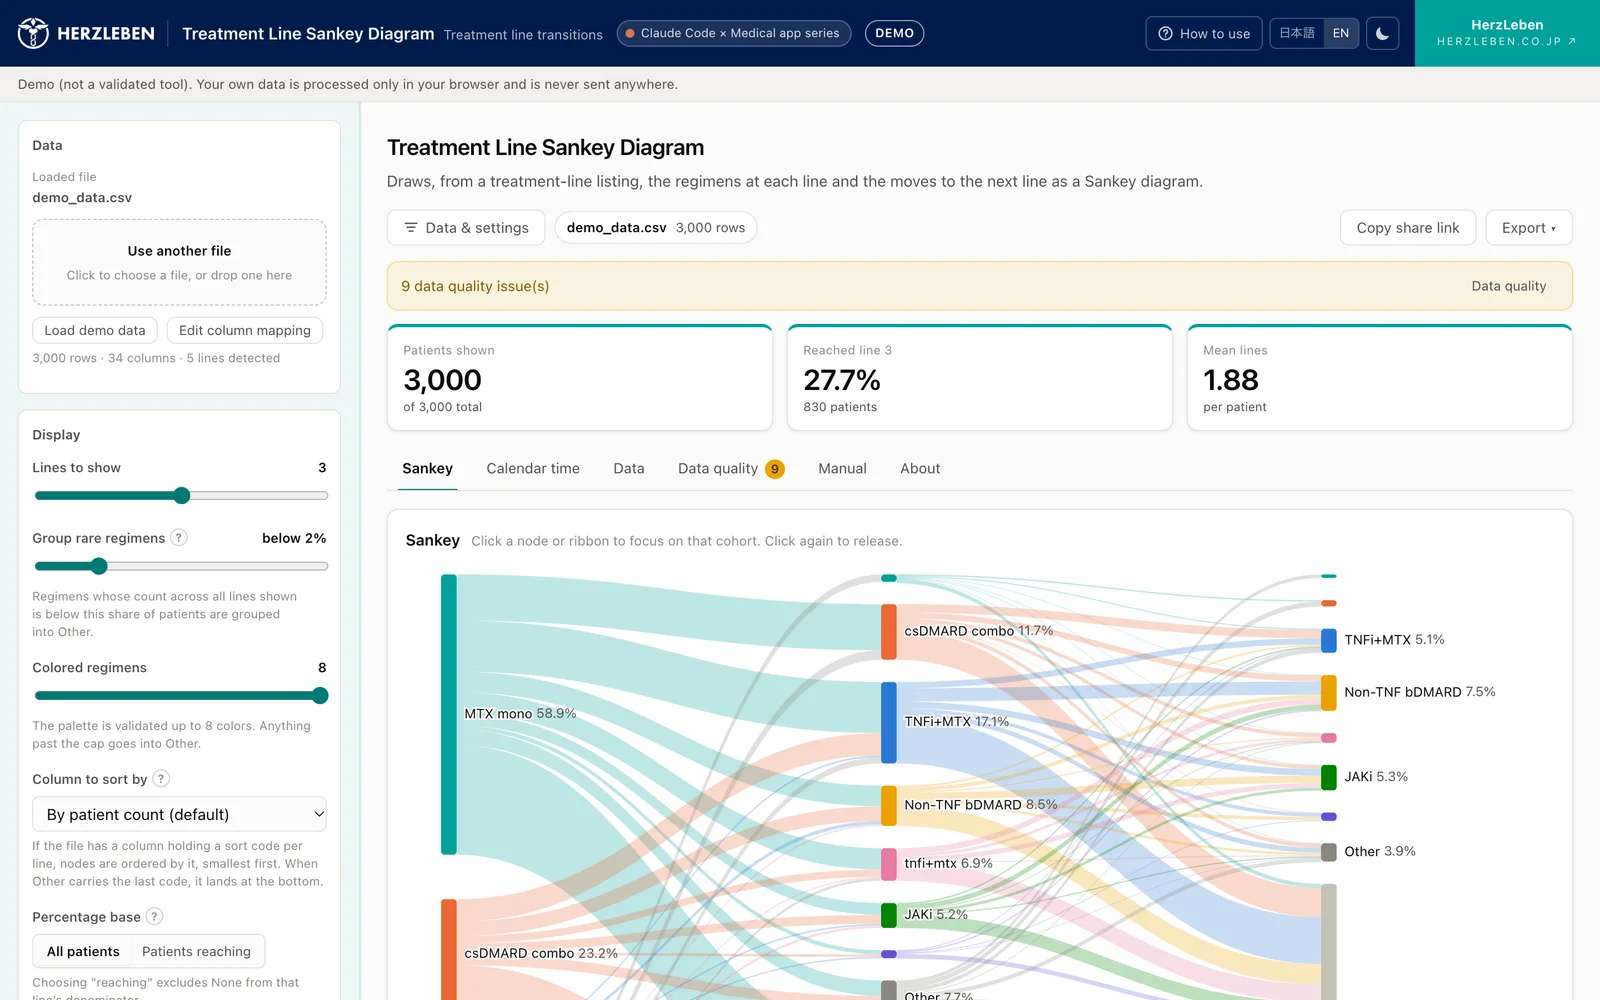
Once the column mapping is confirmed, the transitions between lines of therapy appear as a Sankey diagram. Clicking a bar or band focuses on that patient group only. Conditions such as age and institution can be layered on top, and the current conditions are summarised at the top of the screen.
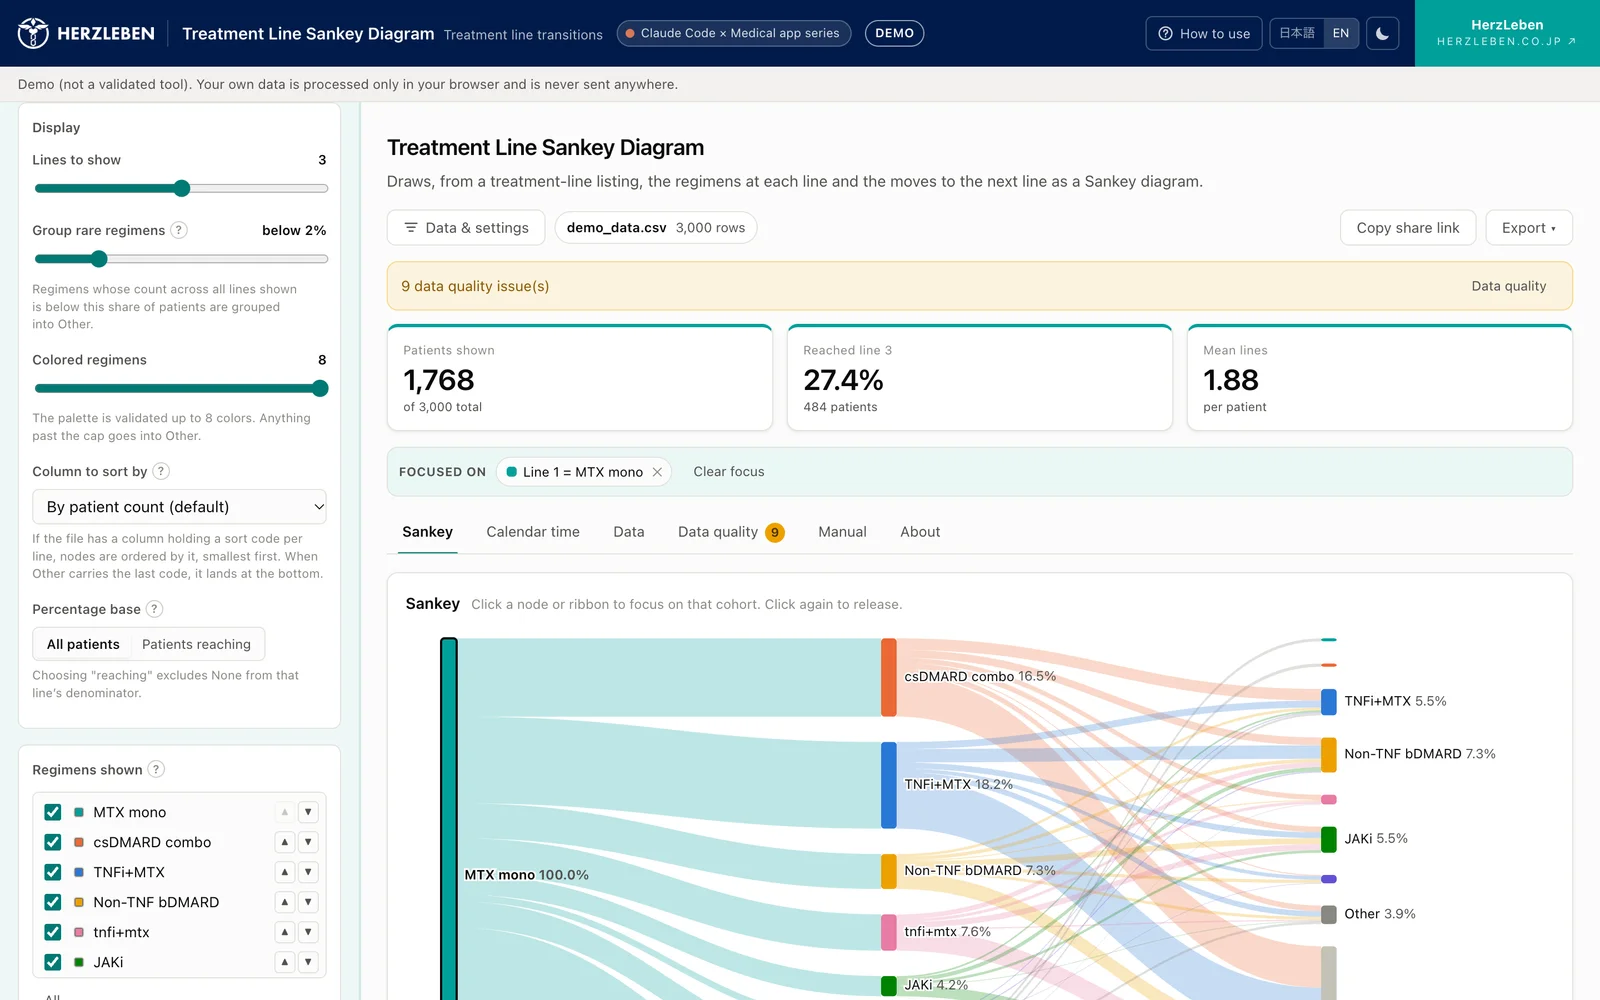
Even after focusing, the order and colours of the bars stay as they were set for the whole data before focusing. Only the bands get thinner, and the same treatment stays in the same place in the same colour, so you can compare before and after (Part 2).
3-3. The settings for tidying the chart are all on screen
- The line for grouping rare treatments into Other (default: below 2%)
- The percentage base (all patients, or the patients who reached that line)
- Order (by patient count, rearranged by hand, or by a column holding sort codes)
- Colours (up to 8, which can be re-chosen from the colour swatches)
3-4. It doesn’t stop at the chart
- Tables of patient counts by line, of transitions, and of trends by the period in which first-line therapy started
- Export charts as PNG or SVG, and aggregates as CSV
- Save the focus conditions as a share link or a JSON file, so the same chart can be reopened later
3-5. Spot problems in the data early
As soon as the data are loaded, the tool lists duplicate patient IDs, inconsistent date order, missing lines and name variants (Part 1, Part 3). For name variants, rules and the AI propose candidates to merge, and people choose which to merge.
3-6. Three steps to use it
- Choose a file (or use the fictitious data that is included from the start)
- Check the column mapping
- Click the chart to focus
No sign-up and no installation. The tool is available in Japanese and English.
4. Compared with the usual approach
| The usual approach | Treatment Line Sankey Diagram | |
|---|---|---|
| Drawing the chart | Write code in R or Python | Just load the data |
| Shape of the data | Reshape into “from where, to where, how many” | The analysis listing as it is |
| Changing conditions | Fix the code and redraw | Focus by clicking |
| Comparing before and after | Redrawing changes order and colours | Order and colours stay the same |
| Name variants | Fixed by hand | Candidates to merge are proposed |
| Who can use it | People who can write code | Anyone who can use the screen |
| Preparation | An analysis environment | Just a browser |
The person who draws the chart and the person who looks at it and thinks become the same person. If you think “I’d like to see only the patients who moved from this treatment,” you can see it on the spot with a click.
5. Where it helps
| Function | Setting | How it helps |
|---|---|---|
| Medical affairs | Understanding actual treatment practice, congress presentations and publications | Find out in which line your company’s drug is used and what patients switch from, and show it as a figure |
| Marketing and sales planning | Explaining treatment pathways | Compare year by year how pathways changed after a new drug launched |
| RWE and epidemiology | A first look before a study | Before planning, check patient counts by line and whether the treatment pairs you want to compare have enough patients |
| HTA and market access | Preparing for cost-effectiveness evaluation | Find out, line by line, “the treatment currently used” that will be the comparator |
In every setting, the tool does not replace research analyses; it is an aid for understanding treatment pathways and narrowing down the groups to examine.
6. Designed to be safe to use
Prescription data can almost never be uploaded to external services. So the tool is designed as follows.
- All aggregation happens in the user’s browser: the loaded file is never sent to a server, and it is gone when the page is closed. Once loading has finished, you can draw and focus the chart even with the network disconnected
- Only names and counts are passed to the AI: the AI used to propose column mappings and merges of name variants receives only the column names and types, and the regimen names and their counts. Individual patient records are not passed on. Its answers are proposals, and people make the final decision
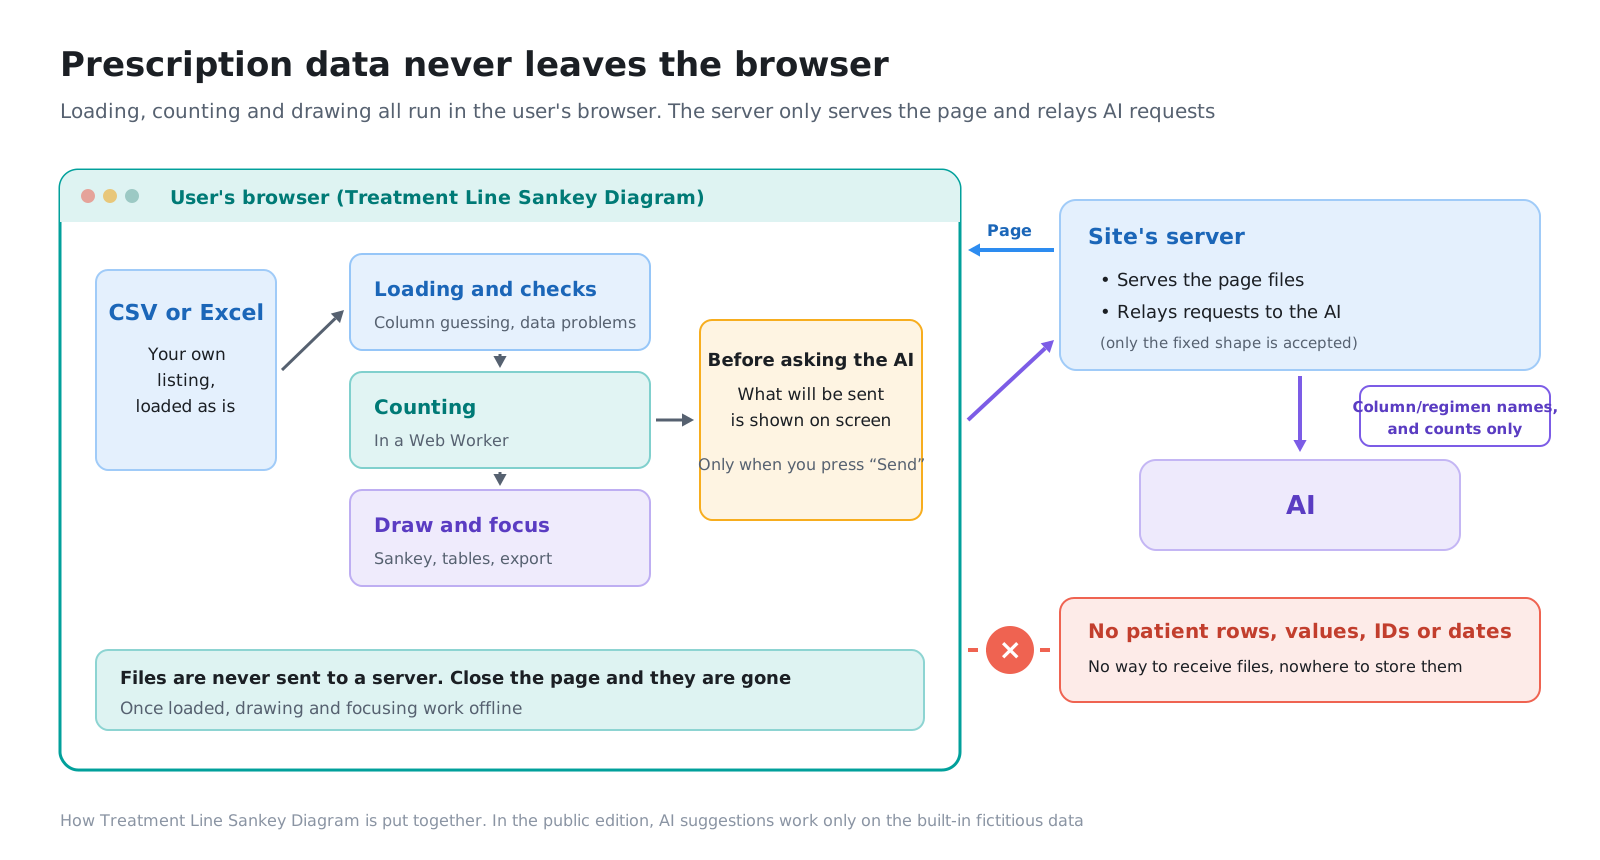
In the public tool, AI suggestions can be tried only with the fictitious data that is included from the start. When you load your own file, the AI button is locked and nothing is sent to the AI. A form that uses AI suggestions with your own data is available as the deployed edition, which is installed in your own environment.
| Public edition (this site) | Deployed edition (installed in your environment) | |
|---|---|---|
| Sankey diagram, focusing, tables, export | All available | All available |
| Your data | Never leave the browser | Never leave your environment |
| AI suggestions | Can be tried only with fictitious data | Available with your own data |
| Support for in-house definitions and code lists | None | Built to match |
Part 4 covers how it works in detail and how to verify it.
7. Where the methods come from
A Sankey diagram is a general chart that shows the size of flows by the width of bands. Using it to view treatment pathways is common in RWD research (reference page).
Because the way lines of therapy are divided differs between studies, the Treatment Line Sankey Diagram concentrates on receiving line columns that have already been divided and showing them. Which rules to use for dividing them is decided by those who prepare the data.
8. Series outline
| Part | Title | Contents |
|---|---|---|
| Reference page | [Business Explainer] Lines of Therapy — How They Are Counted in Real-World Data and How to Read a Sankey Diagram | How lines of therapy are counted, where in RWD to look, pitfalls of Sankey diagrams |
| Part 0 | Overview and Design | This post |
| Part 1 | Loading the Data — Reading Analysis Listings As They Are | Estimating columns from their contents, character encoding, reading Excel, flagging problems in the data |
| Part 2 | Designing the Chart — Keeping Order and Colours Fixed While You Focus | How order and colours are decided, grouping into Other, choosing the base |
| Part 3 | Verifying the Results — Fictitious Patient Data with the Answers Set First | Matching against the answers, deliberately broken input, merging name variants |
| Part 4 (coming soon) | Building In the AI — Only Column Names and Regimen Names Are Sent | What is sent and what is not, how the public edition is limited to fictitious data, how to verify the network traffic |
9. What we did with Claude Code
We left most of the implementation to Claude Code. What people decided was mainly the following:
- That an analysis listing can be charted as it is, without writing code
- That the order and colours of the chart are set for the whole data before focusing
- That the tool is verified with fictitious data whose answers were set first
- That prescription data never leave the browser, that only names and counts are passed to the AI, and that its answers stop at proposals
- That the tool does not decide where lines of therapy are divided
Implementing the aggregation, writing tests and building screens were easy to hand over, but who wants to compare what, what counts as the right answer, and what is enough checking had to be decided by people. Each part shows concretely where that line fell.
Next steps
The tool is live at treatment-line.herzleben.co.jp. You can try it straight away with fictitious rheumatoid arthritis data.
If you would like to discuss tailoring it to your in-house definitions and code lists, or a form that uses AI suggestions with your own data, please get in touch through our contact page.
Sources
- The screenshots and numbers on this page were produced with fictitious rheumatoid arthritis data (3,000 patients). They are not related to any real patient, institution, drug or company