
Claude Code × Medical Application
[Practice Explainer] Systematic Review: Procedure and Quality Standards
1. What a Systematic Review Is
A systematic review (hereafter SR) is a study that, for a single question, collects all relevant studies using a method fixed in advance, appraises each one, and synthesizes the results (Cochrane Handbook v6.5, Section 1.1).
The key point is that an SR is not “a survey of the literature” but a type of research. Ordinary research takes patients or specimens as its subjects; an SR takes already published studies themselves as its subjects. So an SR also has subjects (which studies to include), methods (how to search, appraise, and synthesize), and a plan that writes all of this down in advance.
What “Systematic” Refers To
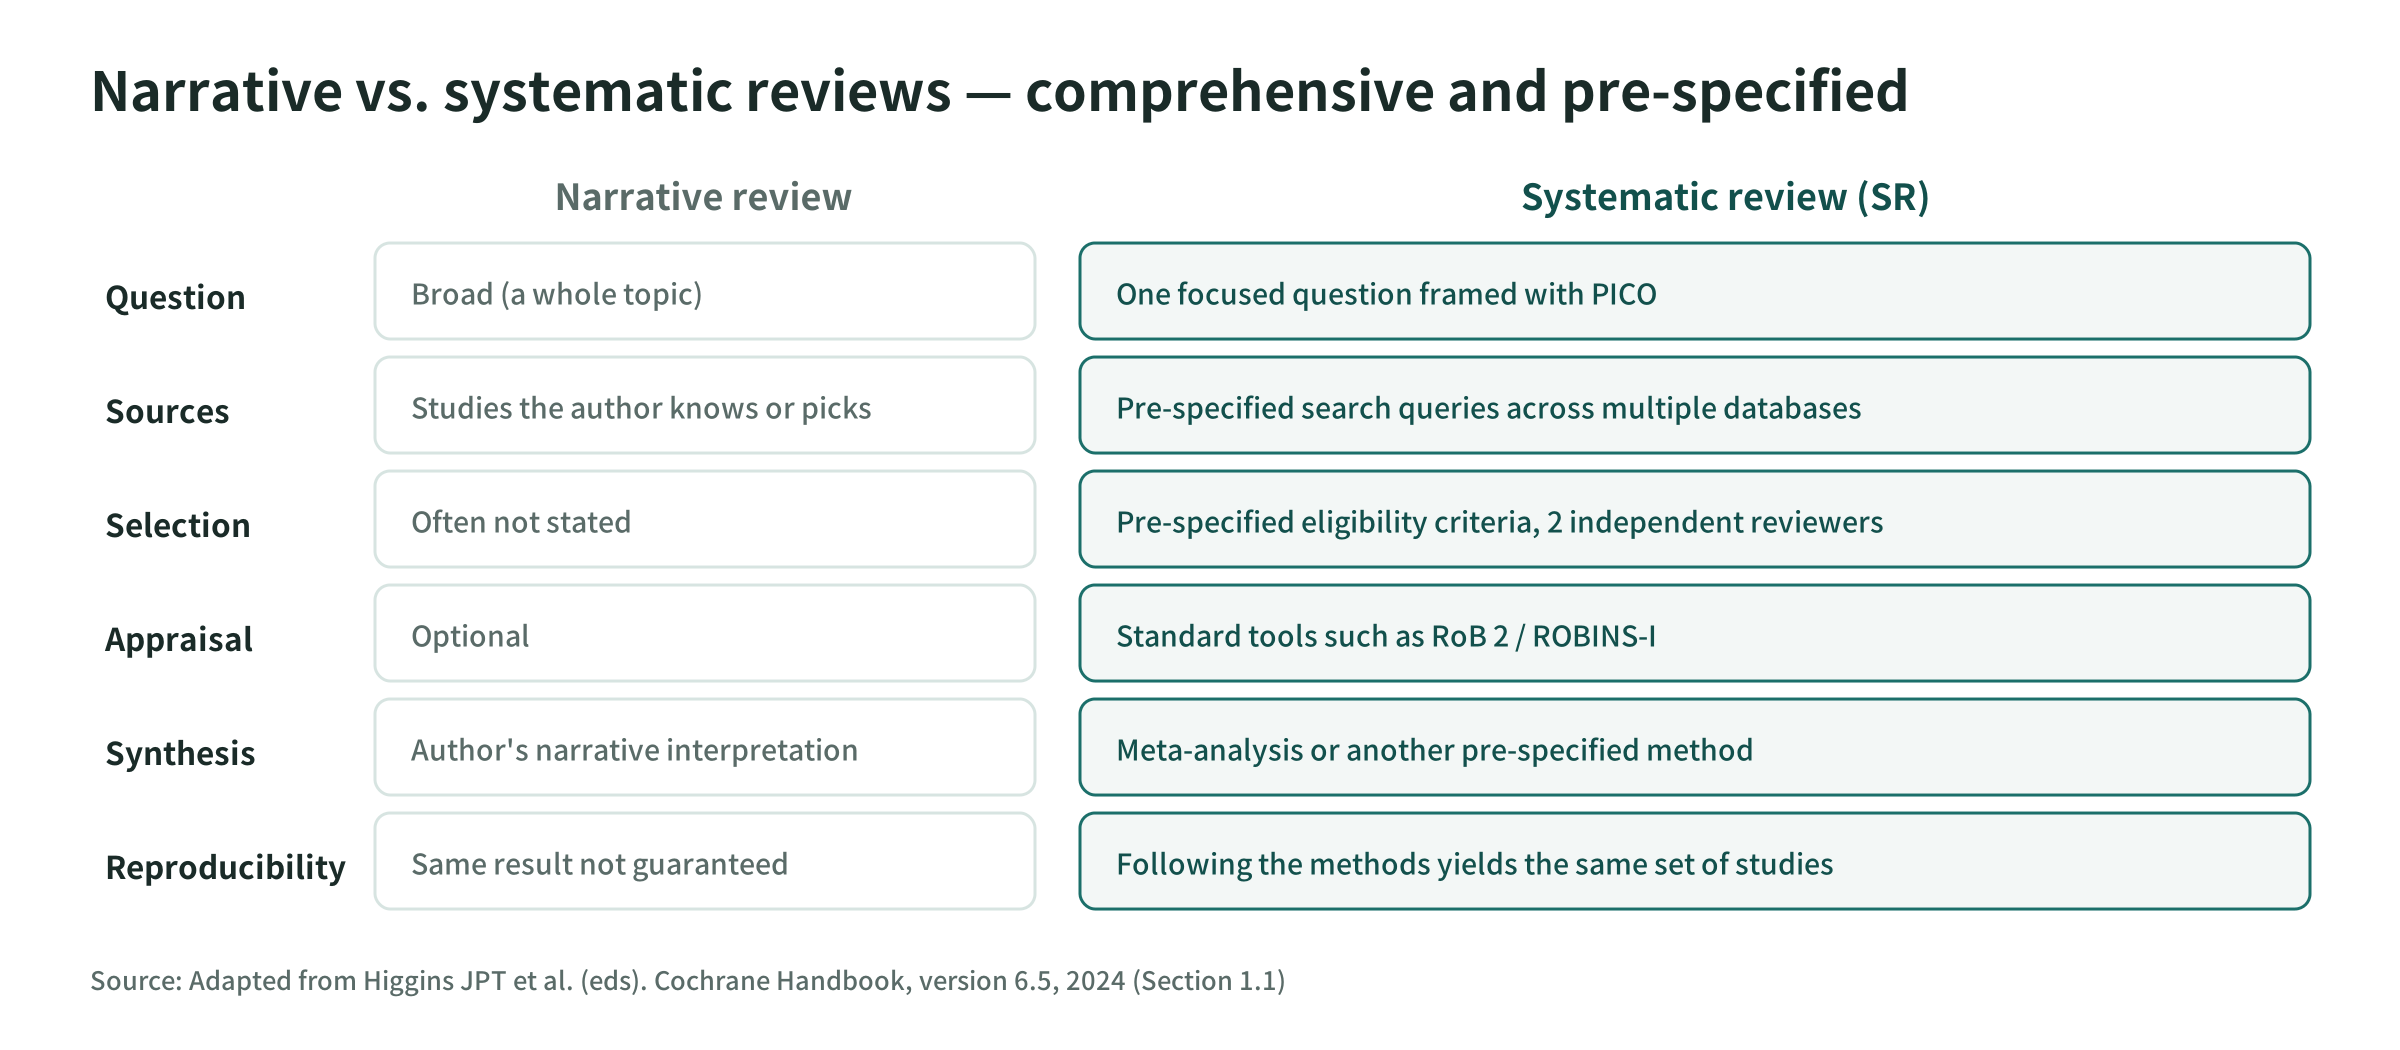
Both are “reviews,” but an SR is built differently from the narrative review you see as review articles in society journals. In a narrative review, an author who knows the field well picks the papers they know and discusses them. It may be excellent reading, but the reader cannot tell why those papers were chosen and others were not. A different author could reach a different conclusion.
An SR is called “systematic” because it satisfies these three conditions.
- Fix the procedure first, and publish it first: write down what to include and what to exclude before reading any literature
- Search exhaustively: collect mechanically with a fixed search query, without bias toward particular journals or databases
- Record the whole process: keep the counts of how many records were found and how many were excluded, and the reasons why
With these three in place, when someone else follows the same procedure, they arrive at nearly the same set of studies. The persuasiveness of the conclusion comes from this reproducibility, not from who the author is.
Relationship to Meta-Analysis
The two are often confused, but SR is the name of a procedure, and meta-analysis is the name of a statistical analysis that may be used within it. Meta-analysis is the calculation that pools the results of the collected studies numerically into a single estimate (with a confidence interval).
It is not unusual to do an SR without doing (or being able to do) a meta-analysis. This happens when the studies differ too much in population, intervention, and measurement, so that adding up the numbers would give a meaningless average. In that case the synthesis is done in words, and it is called a qualitative SR. Conversely, running a meta-analysis on top of someone else’s SR does not by itself make an SR, because the way the studies were collected is not guaranteed.
2. Position in the Evidence Hierarchy
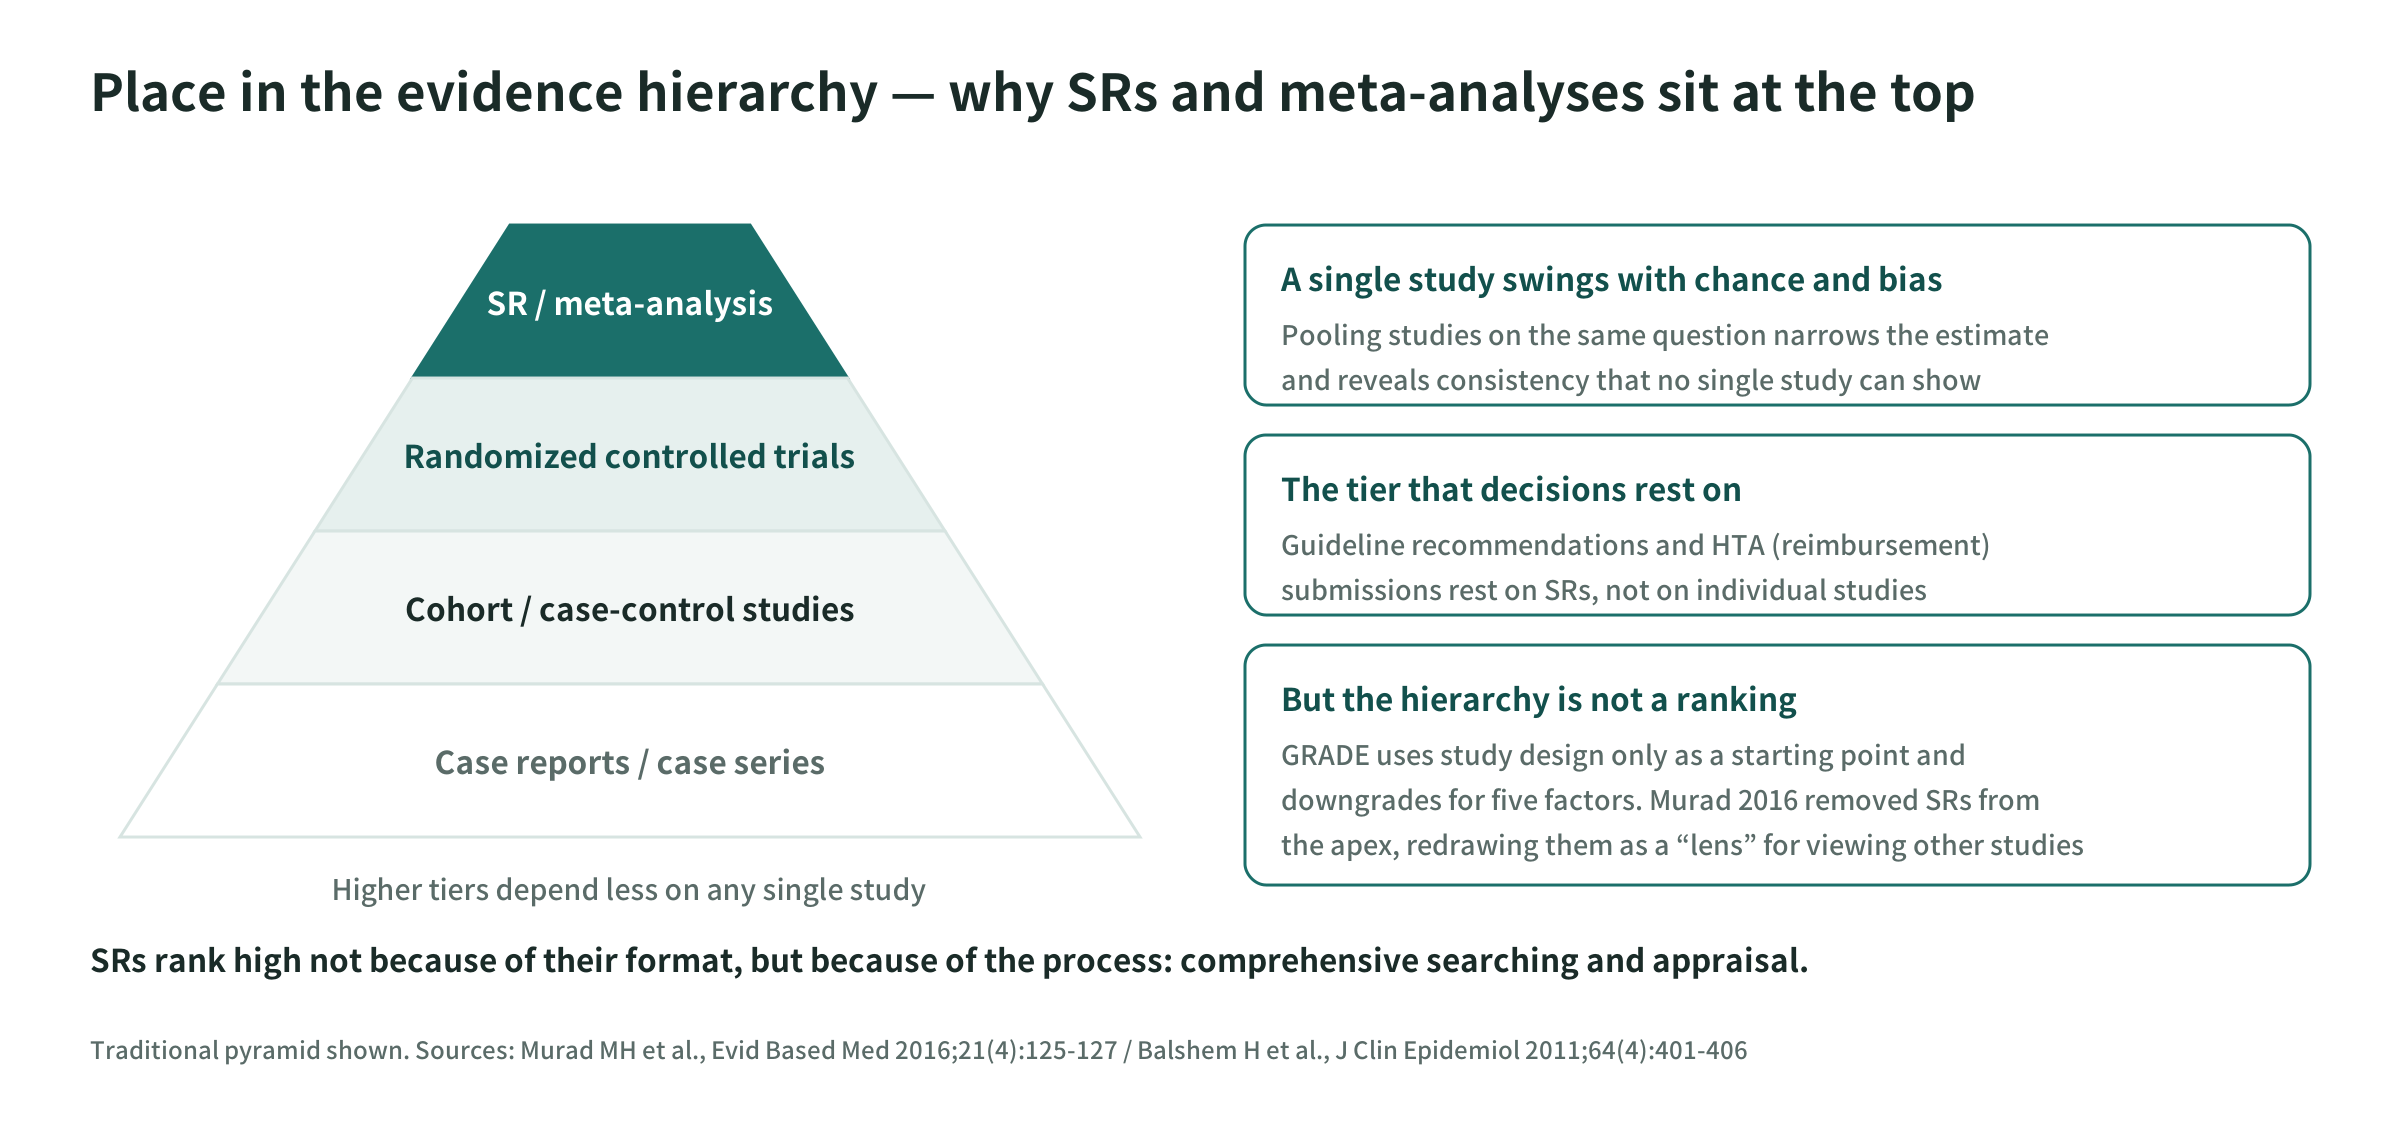
Medical evidence is discussed as a hierarchy (levels of evidence) by study design. In the traditional pyramid, from the bottom up, come case reports and case series, observational studies such as case-control and cohort studies, randomized controlled trials (RCTs), and at the very top SRs and meta-analyses.
The reason they sit at the top is simple: the result of any single study always fluctuates. There are two sources of this fluctuation. One is chance (it happened to come out that way in that particular study population); the other is bias specific to that study (how allocation was done, how outcomes were measured, how dropouts were handled). When you collect and pool studies addressing the same question, fluctuations due to chance cancel out and the estimate narrows, and you can see consistency (or inconsistency) that a single study cannot reveal.
This is why clinical practice guideline recommendations and submissions for health technology assessment (reimbursement) rest on SRs rather than individual papers. Note that regulatory review of drug approvals is decided mainly on the results of individual confirmatory trials.
However, being high in the hierarchy does not by itself guarantee quality. GRADE (described later) uses study design only as the starting rating, and downgrades for risk of bias, inconsistency, indirectness, imprecision, and publication bias. An SR that skips steps does not rank high. Think of the pyramid not as a league table where “calling it an SR wins,” but as a rating of the procedure of “collecting exhaustively and appraising quality.”
Murad et al. (2016) push this idea further and propose removing SRs from the top of the pyramid and redrawing them as a “lens” through which the other study designs are viewed.
3. Why It Became Necessary
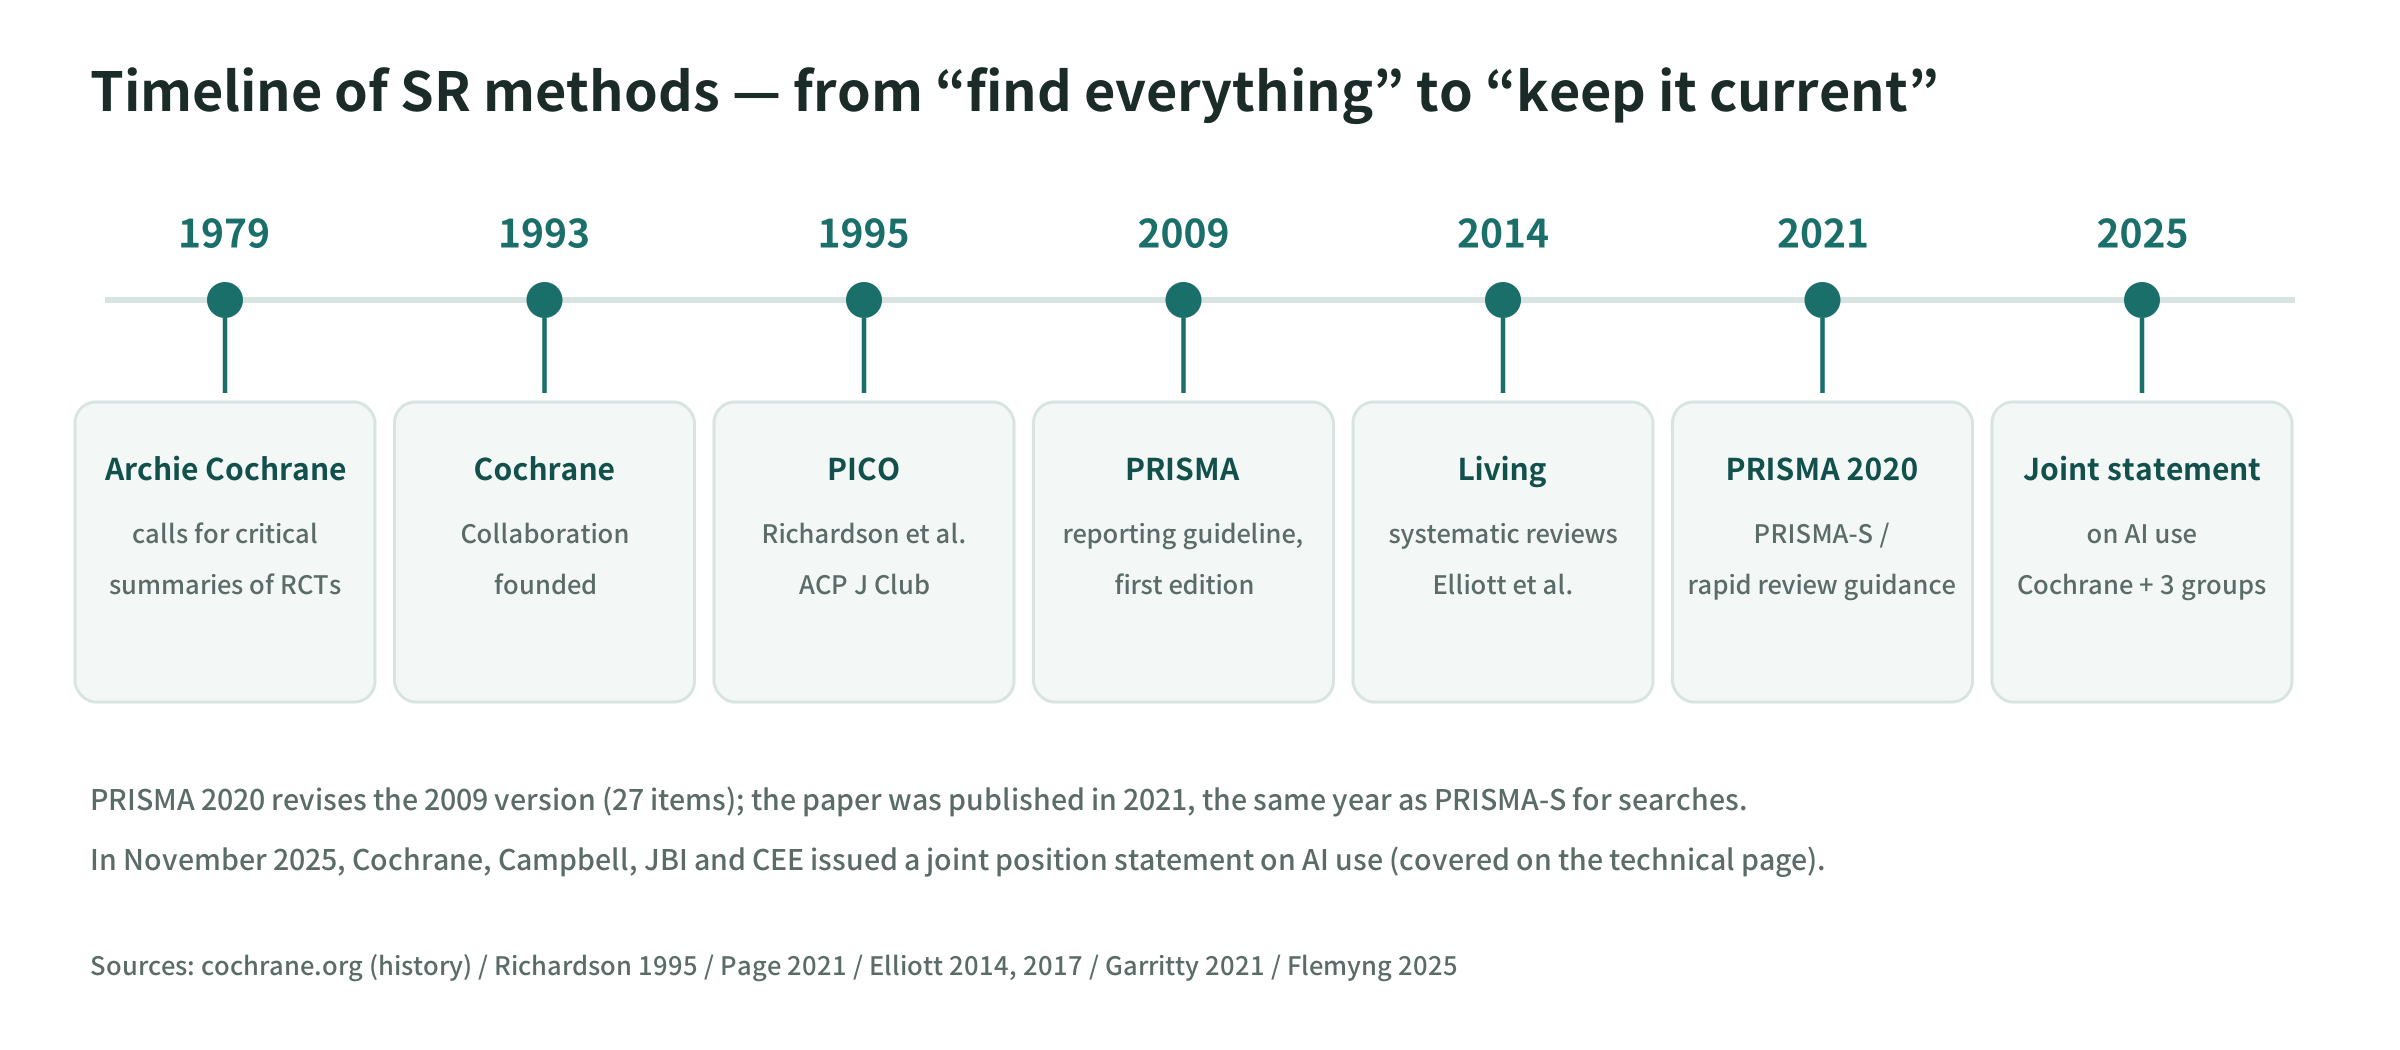
SR was developed as a method because the volume of primary research exceeded what people can read. PubMed holds more than 40 million records and keeps growing every day. It has become physically impossible for a clinician to read every paper in their specialty and judge for themselves.
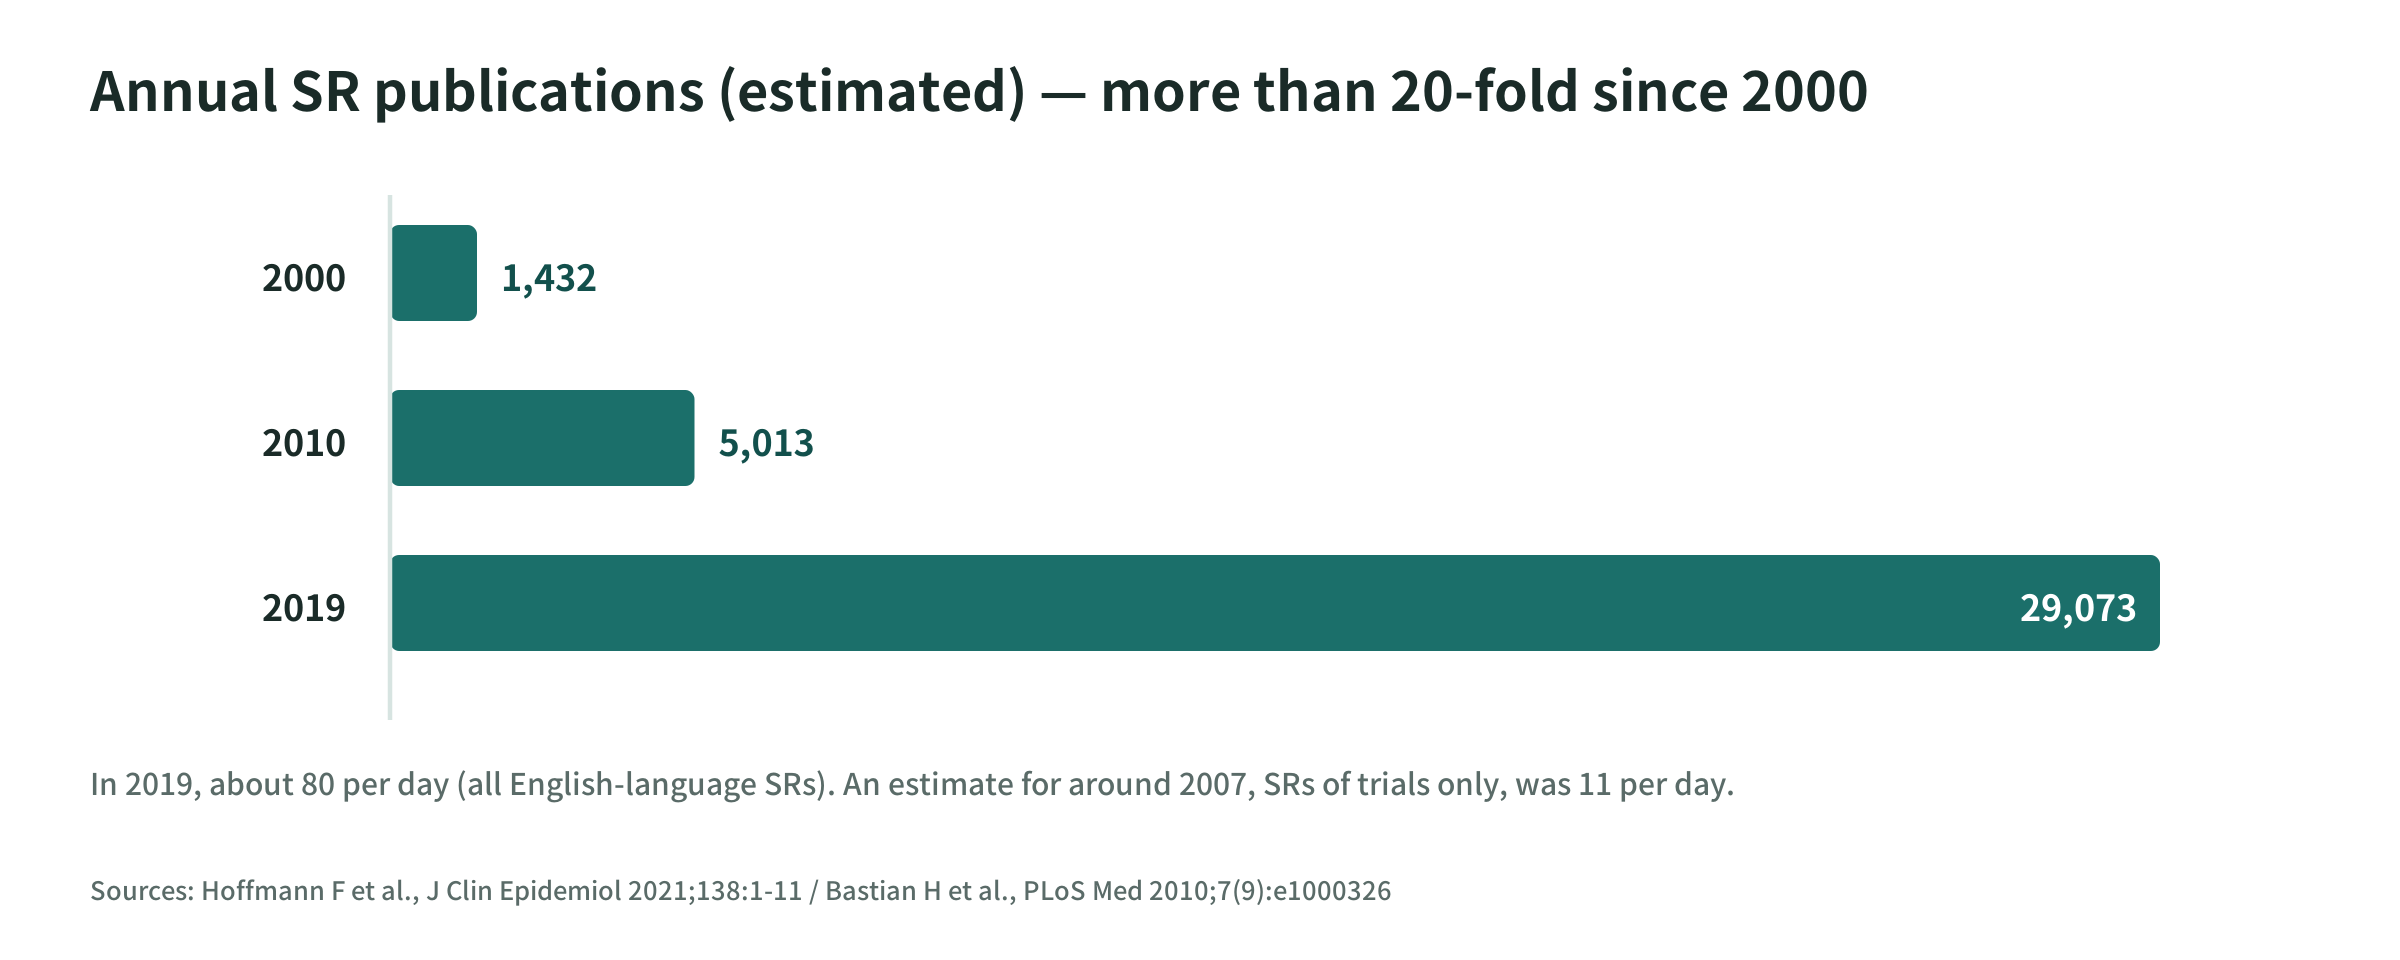
Ironically, SRs themselves are also increasing. In 2019, about 30,000 SRs were published in a year, which works out to about 80 SRs per day. That is more than 20 times the roughly 1,400 published in 2000.
4. The Six Steps
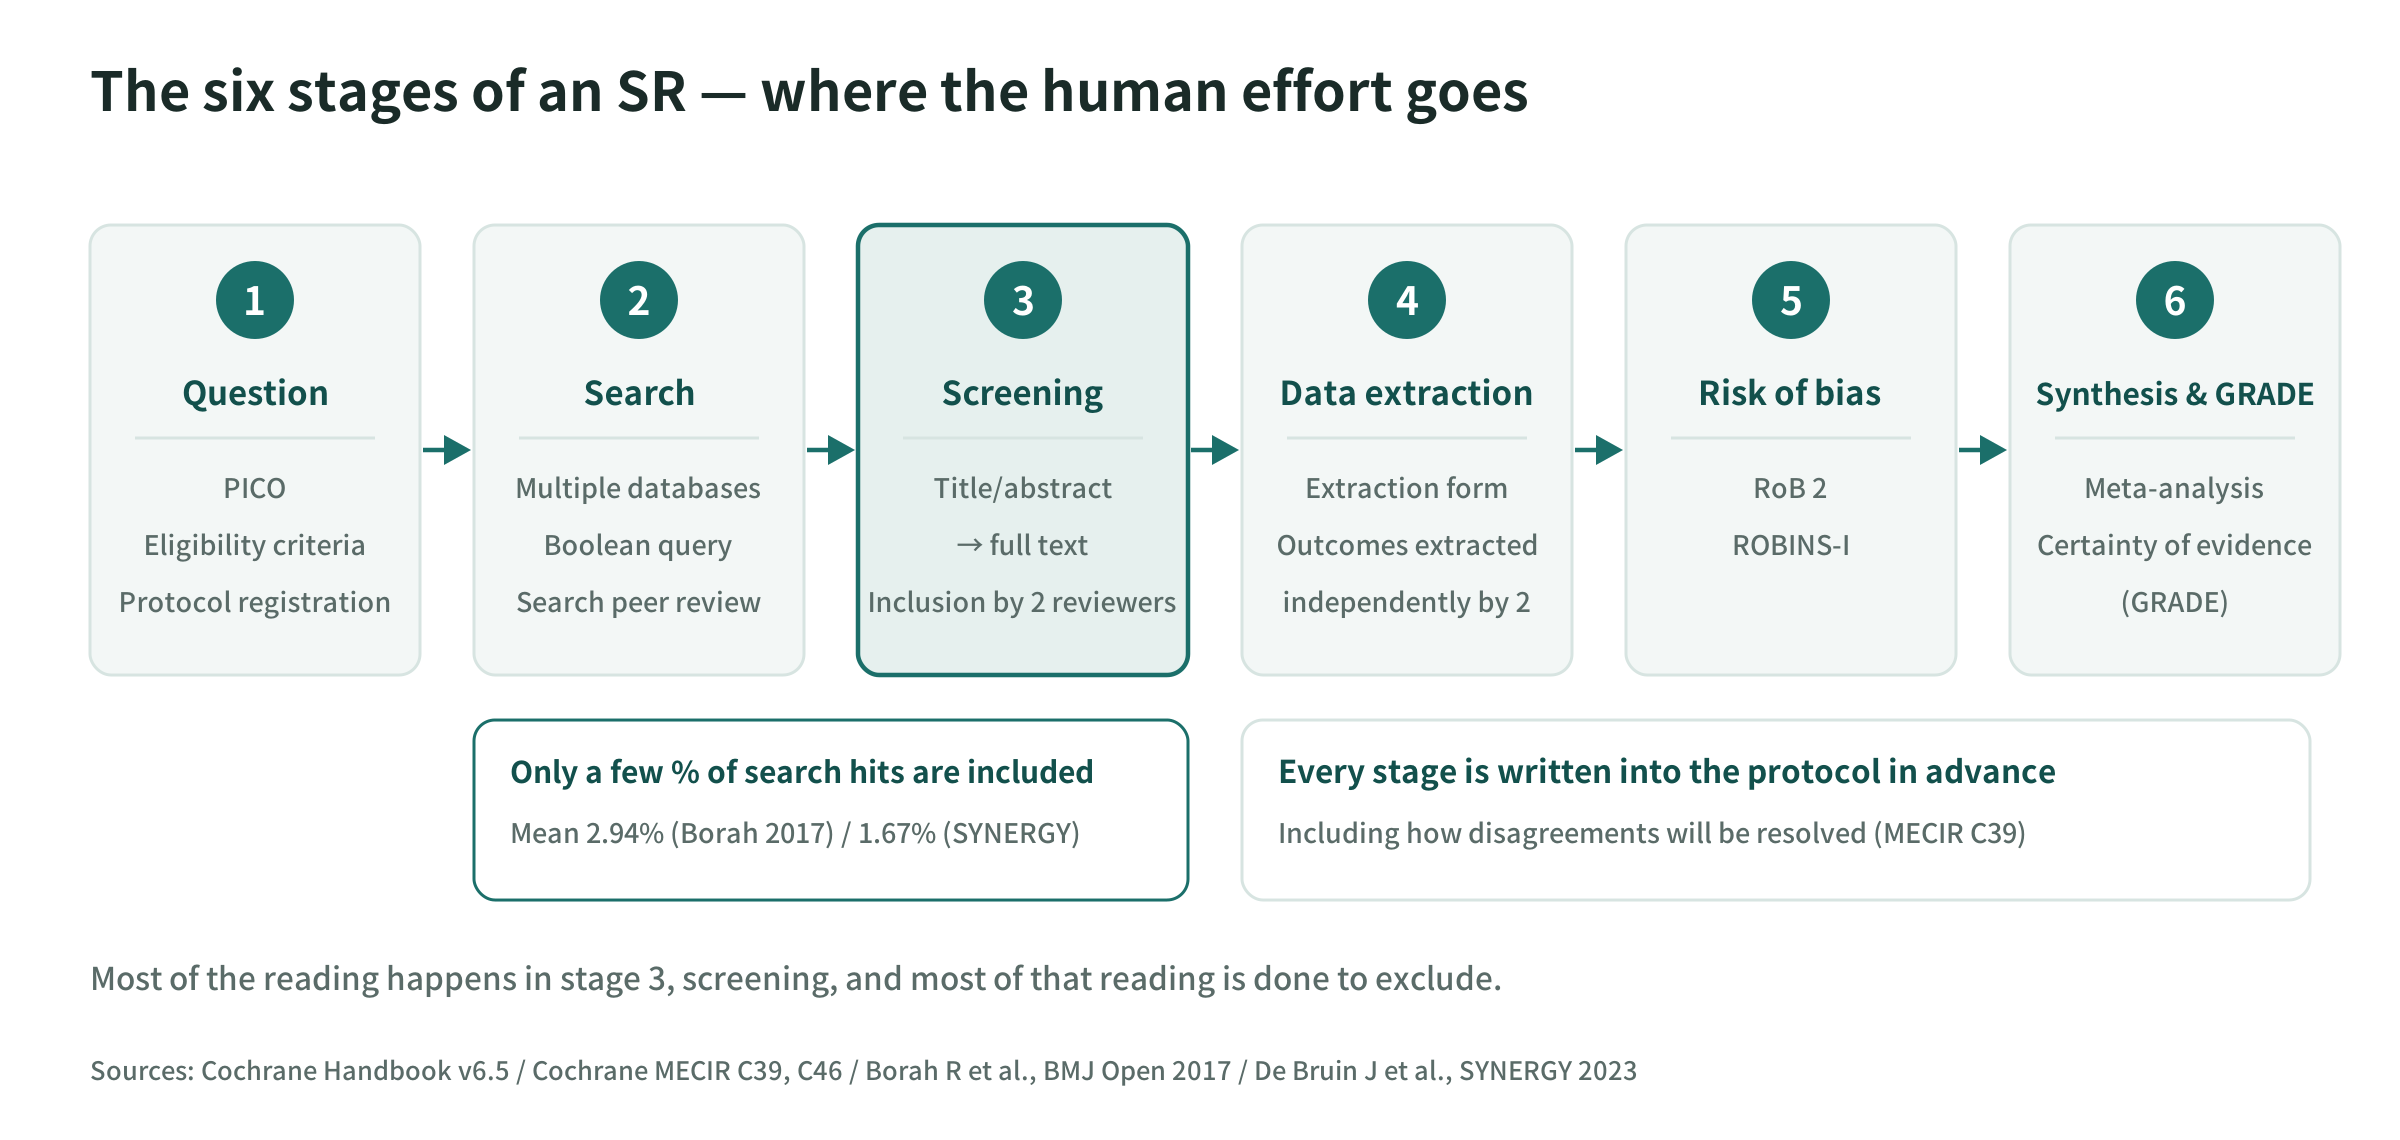
| Step | What you do | Output |
|---|---|---|
| 1. Formulating the question | Write the question in PICO, set the eligibility criteria, write them into a protocol and register it | Protocol (PROSPERO registration number) |
| 2. Search | Search multiple databases with the search query and remove duplicates | Search query, search date, number of hits |
| 3. Screening | Narrow down in two stages: title/abstract, then full text | List of included studies and reasons for exclusion |
| 4. Data extraction | Extract predefined items from each paper | Extraction form (table of study characteristics) |
| 5. Risk of bias assessment | Judge, domain by domain, the risk that results deviate systematically | Assessment sheet |
| 6. Synthesis and certainty | Summarize qualitatively, run a meta-analysis if possible, rate with GRADE | Forest plot, SoF table |
Below, I go through each one at the level of procedure.
4.1 Formulating the Question: PICO, Eligibility Criteria, Protocol
The first thing to do is trim the question into an answerable form. “Does this drug work?” is too broad to decide which studies to include. So you write it in four slots called PICO.
| Letter | Stands for | Content | Example |
|---|---|---|---|
| P | Patient / Population | Who the subjects are | Adults with type 2 diabetes |
| I | Intervention | What is done | SGLT2 inhibitors |
| C | Comparison | What it is compared with | Placebo or other oral glucose-lowering drugs |
| O | Outcome | What is measured | Cardiovascular death, severe hypoglycemia, HbA1c |
Once PICO is set, you turn it into eligibility criteria (inclusion and exclusion criteria). In addition to the four PICO elements, you decide the study design (RCTs only, or observational studies as well), the range of publication years, language, the minimum follow-up period, the minimum sample size, and so on. If these are vague, reviewers will split on judgments during screening later.
What you decide is written into a protocol (the SR’s plan). There is a checklist for its format called PRISMA-P, and health-related SRs can be registered in an international registry called PROSPERO. Registration is not mandatory, but many journals effectively require it.
Why fix it before searching? Because if you set the criteria after reading the literature, you can pick the studies that suit you after seeing the results. A judgment like “this study is low quality, so let’s drop it” becomes justifiable once you have seen the results. To prevent this, you write it first and publish it first.
In SRs for clinical practice guideline development (the Minds approach), a distinctive feature is that a separate set of studies is built for each outcome. For a single intervention, separate sets are built for efficacy outcomes and adverse event outcomes, so the same paper may be adopted for multiple outcomes.
4.2 Search: Building the Search Query and Collecting Without Gaps
The databases to use should at minimum cover the following (in the Minds approach, PubMed/MEDLINE, the Cochrane Library, and Ichushi-Web are mandatory).
- PubMed / MEDLINE: biomedicine in general; US NLM
- Embase: Europe-centered; strong on drugs and adverse events
- Cochrane Library (CENTRAL): a register collecting randomized controlled trials
- Ichushi-Web: Japanese-language literature
- Depending on the field, CINAHL (nursing), PsycINFO (psychology), and others
A single database will miss studies, because indexing practices and journal coverage differ.
Building the search query generally follows these steps.
- Extract concepts from the P and I of PICO (and C if needed). As a rule, O is not put into the search query. Outcomes are sometimes not mentioned in the title or abstract, and including them causes misses
- For each concept, prepare both controlled vocabulary (MeSH for PubMed, Emtree for Embase) and free-text terms (words in the title and abstract). Controlled vocabulary consists of tags assigned by indexers, so it is robust to spelling variants; free-text terms pick up new terms and records that have not yet been indexed
- List synonyms, abbreviations, British/American spellings, and singular/plural forms (e.g.,
neoplasm/cancer/tumour/tumor). Variant endings are combined with a truncation symbol (cancer*) - Connect terms within the same concept with OR, and concepts with each other with AND
- Syntax differs by database, so build one master search query first and then translate it for each database
SR searching has the opposite goal from everyday literature searching. Normally you want to efficiently find “a few papers worth reading.” In an SR, not missing a single study is the top priority, so you cast a wide net, accepting the added noise. As a result you get thousands of hits, or tens of thousands depending on the topic.
Database searching alone is not enough, so you also do the following.
- Grey literature: conference abstracts, theses, government reports, company reports. It is said that more than half of studies reported as conference abstracts never become full papers, and ignoring them introduces publication bias
- Clinical trial registries: ClinicalTrials.gov, jRCT, WHO ICTRP. To find trials whose results have not been published
- Citation tracking (snowballing): follow the reference lists of included papers (backward), and follow papers that cite them (forward)
- Hand searching: leafing through the tables of contents of key journals by hand
It is recommended that the search query be peer-reviewed by another information retrieval specialist using the PRESS (Peer Review of Electronic Search Strategies) standard. The Minds approach likewise says that one of the two members of the SR team should be a medical literature search specialist.
Finally, record the search query itself and the search date verbatim. PRISMA-S (16 items) requires reporting enough information for readers to reproduce the same search. The collected records are imported into reference management software (EndNote, Zotero, etc.), and duplicates are removed before they go to screening.
4.3 Screening: Title/Abstract and Full-Text Stages
This is the step that narrows thousands of collected records down to the dozens that are included. It is where the most reading happens in an SR.
Title/abstract screening judges records by looking only at the title and abstract. Since it is a judgment of whether the full text is worth retrieving, the rule is when in doubt, keep it. If you wrongly drop a record here, later steps will never pick it up again.
Full-text screening obtains the full text of the remaining records and checks them against the eligibility criteria. This is where the set of studies is finalized.
The following points are fixed as procedure.
- Two people judge independently. Cochrane’s MECIR makes this mandatory as C39. The important word here is “independently.” If the second reviewer sees the first reviewer’s judgments, they tend to simply ratify the errors
- Run a pilot beforehand. Don’t start on all records at once; have two people judge the first 50 to 100 records, use the disagreements to uncover misreadings of the criteria, and revise the wording of the eligibility criteria
- Check agreement. Look at agreement between the two reviewers with the kappa (κ) coefficient or similar. A low value signals that the criteria are ambiguous
- Resolve disagreements by discussion; if that fails, a third person decides. The resolution method is also written into the protocol in advance
- For full-text exclusions, record a reason for each record. PRISMA 2020 requires a list of the studies excluded after full-text review, with reasons
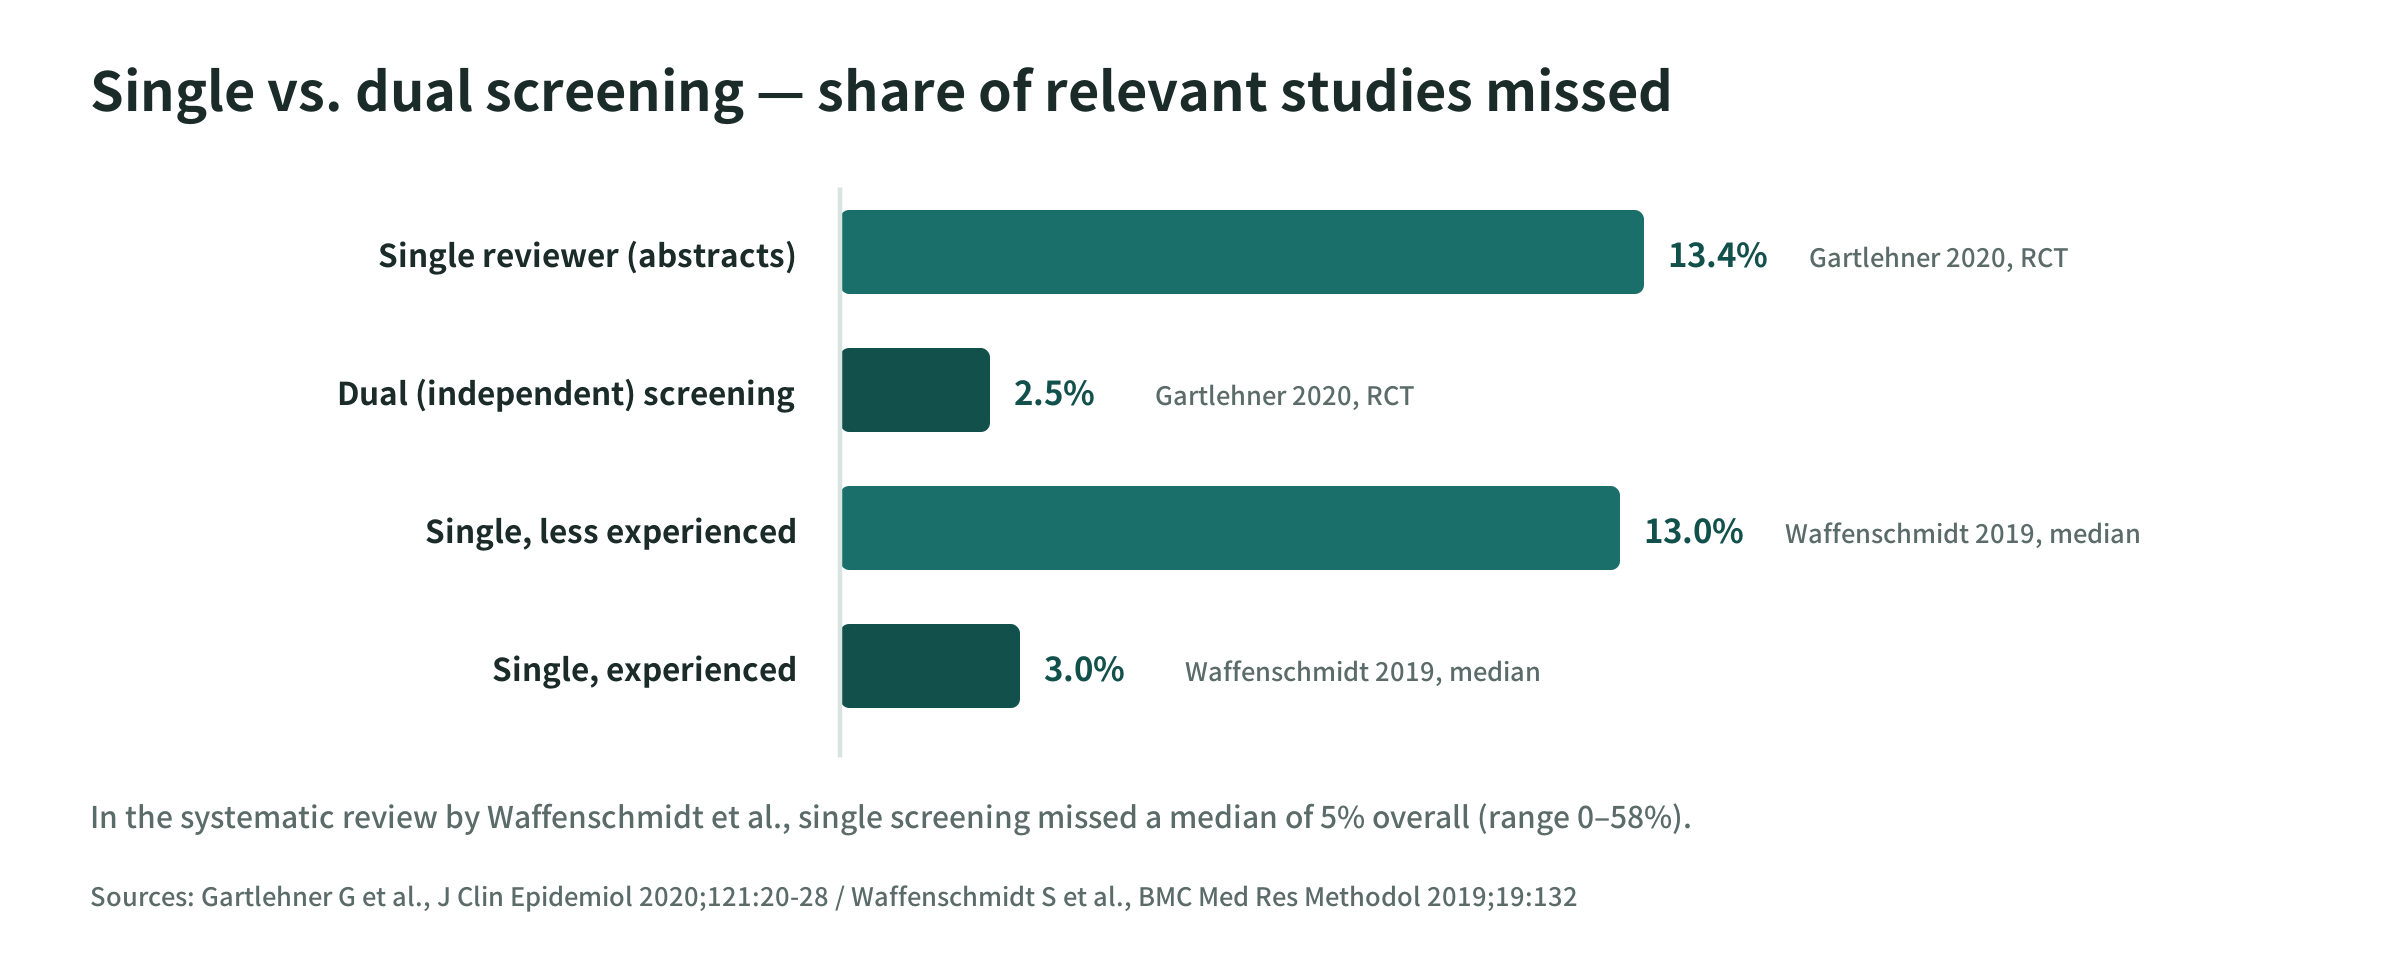
Why two people? Because it has been repeatedly reported that a single reviewer misses around 10% of relevant studies (13.4% vs. 2.5% in Gartlehner 2020; a median of 13% for less experienced reviewers in the systematic review by Waffenschmidt 2019).
It also helps to get a feel for the volume. Of the search hits, on average 2.94% end up included (Borah 2017). In the public screening dataset SYNERGY, it is 1.67%. In other words, more than 97% of the reading is reading in order to exclude. This asymmetry is what later leads to the topic of automation.
4.4 Data Extraction: Pulling Numbers Out of Papers
Once inclusion is finalized, you extract the predefined items from each paper. Here too, outcome data must be extracted independently by two people (MECIR C46).
Build the extraction form in advance and pilot it on a few papers. If you add items as you go, the papers extracted first will be missing those items. Typical items are as follows.
- Bibliographic: authors, publication year, country, funding source, conflicts of interest
- Study design: RCT or observational study, unit of allocation, whether blinded, follow-up period
- Participants: inclusion criteria, number, age, severity, comorbidities
- Intervention and comparator: drug name, dose, duration, content of the comparator
- Outcomes: definition, measurement method, time points
- Results: n in each group, number of events or mean and standard deviation, effect size and confidence interval
In practice, two things trip people up.
One is that the numbers you need are not in the paper: only the median and interquartile range, or only a graph, for example. You respond by contacting the authors, reading values off the graph, or estimating from other statistics, and you record which of these you did.
The other is that one trial is split across multiple papers. The primary outcome paper, the long-term follow-up paper, and the subgroup analysis paper may be published separately. If you count these as separate studies, you double-count the same patients. What you count is trials, not papers.
4.5 Risk of Bias Assessment
This is the step that judges whether the results of the collected studies can be taken at face value. What you look at is not how “well done” a paper is, but the risk that the results deviate systematically from the true value (risk of bias).
The judgment is made per outcome, not per study. Even within the same paper, bias enters differently into an objectively measured mortality rate and a pain score that involves the patient’s subjective judgment.
For RCTs, use RoB 2. Each of the following five domains is judged as “low risk / some concerns / high risk,” and an overall judgment is given.
- Bias arising from the randomization process: was the random sequence generated appropriately, was allocation concealed, is there baseline imbalance
- Bias due to deviations from intended interventions: did participants and care providers know the allocation, did their behavior change as a result, was the analysis ITT
- Bias due to missing outcome data: how much dropout there was, whether reasons for dropout differ between groups
- Bias in measurement of the outcome: did outcome assessors know the allocation, was the measurement method the same between groups
- Bias in selection of the reported result: are all outcomes in the protocol reported, were only favorable analyses presented
For non-randomized studies, use ROBINS-I. It has seven domains: in addition to the five domains of RoB 2, it adds confounding (the groups being compared differ in background) and selection of participants. Confounding is the biggest problem in observational studies, so it gets its own domain.
In Japan’s Minds approach, assessment sheets are built on the traditional five categories (selection bias / performance bias / detection bias / attrition bias / other bias), and a version aligned with RoB 2 is also available. Each domain is scored “low 0 / moderate or suspected −1 / high −2” and summarized.
For observational studies, factors that raise the rating are also assessed: a dose-response gradient, residual confounding that, if anything, would weaken the effect, and a very large effect (+2 for RR > 5 or < 0.2, +1 for RR > 2 or < 0.5).
4.6 Synthesis and Certainty of Evidence
First, you carry out a qualitative SR. For each outcome, you describe what can be said about the collected studies as a whole (the body of evidence), together with the number of studies, number of participants, risk of bias, and variation in the direction of results.
Then, where quantitative pooling is possible, you move on to a meta-analysis (quantitative SR). A meta-analysis is not mandatory. Minds says it is unnecessary when the strength of evidence can be assured qualitatively (for example, when all included papers show the same result), when there is only one study of a given design, or when an existing meta-analysis is available.
The practical decisions in a meta-analysis are as follows.
- Effect measure: for binary outcomes, risk ratio (RR), odds ratio (OR), or risk difference (RD). For continuous outcomes, mean difference (MD), or standardized mean difference (SMD) when scales differ. When time is involved, hazard ratio (HR)
- Pooling model: the fixed-effect model, which treats the collected studies as the only population of interest, and the random-effects model, which treats them as randomly drawn from an underlying population of studies. The random-effects model is recommended because it allows for true variation between studies
- Checking heterogeneity: line up each study’s effect size and confidence interval in a forest plot and look at the variation with indices such as I². When variation is large, don’t force everything into one number; explore the causes (participants, dose, follow-up period) with subgroup analyses
- Checking publication bias: look for asymmetry in the funnel plot. If small studies with negative results go unpublished, the left and right sides become asymmetric
- Sensitivity analysis: check “does the conclusion change if high-risk studies are removed?” and “does it change with a fixed-effect model?”
Finally, the certainty of evidence for each outcome is rated with GRADE on four levels (high, moderate, low, very low). RCTs start at “high” and observational studies at “low,” and are downgraded for the following five reasons.
- Risk of bias: the included studies have a high risk of bias
- Inconsistency: the direction or size of results is not consistent across studies
- Indirectness: the PICO you want to know about and the PICO of the studies diverge (different participants, surrogate outcomes)
- Imprecision: wide confidence intervals, few events
- Publication bias: suspicion that unfavorable results have not been published
For observational studies, the rating is raised by the three factors mentioned above (large effect, dose-response gradient, residual confounding that would weaken the effect).
The results are compiled into an SoF table (Summary of Findings table). For each outcome, it lays out on a single page the number of participants, the size of the effect (relative and absolute), the certainty rating, and the reasons for any downgrading. Clinical practice guideline recommendations are made by looking at this table.
5. The Reporting Format: PRISMA 2020
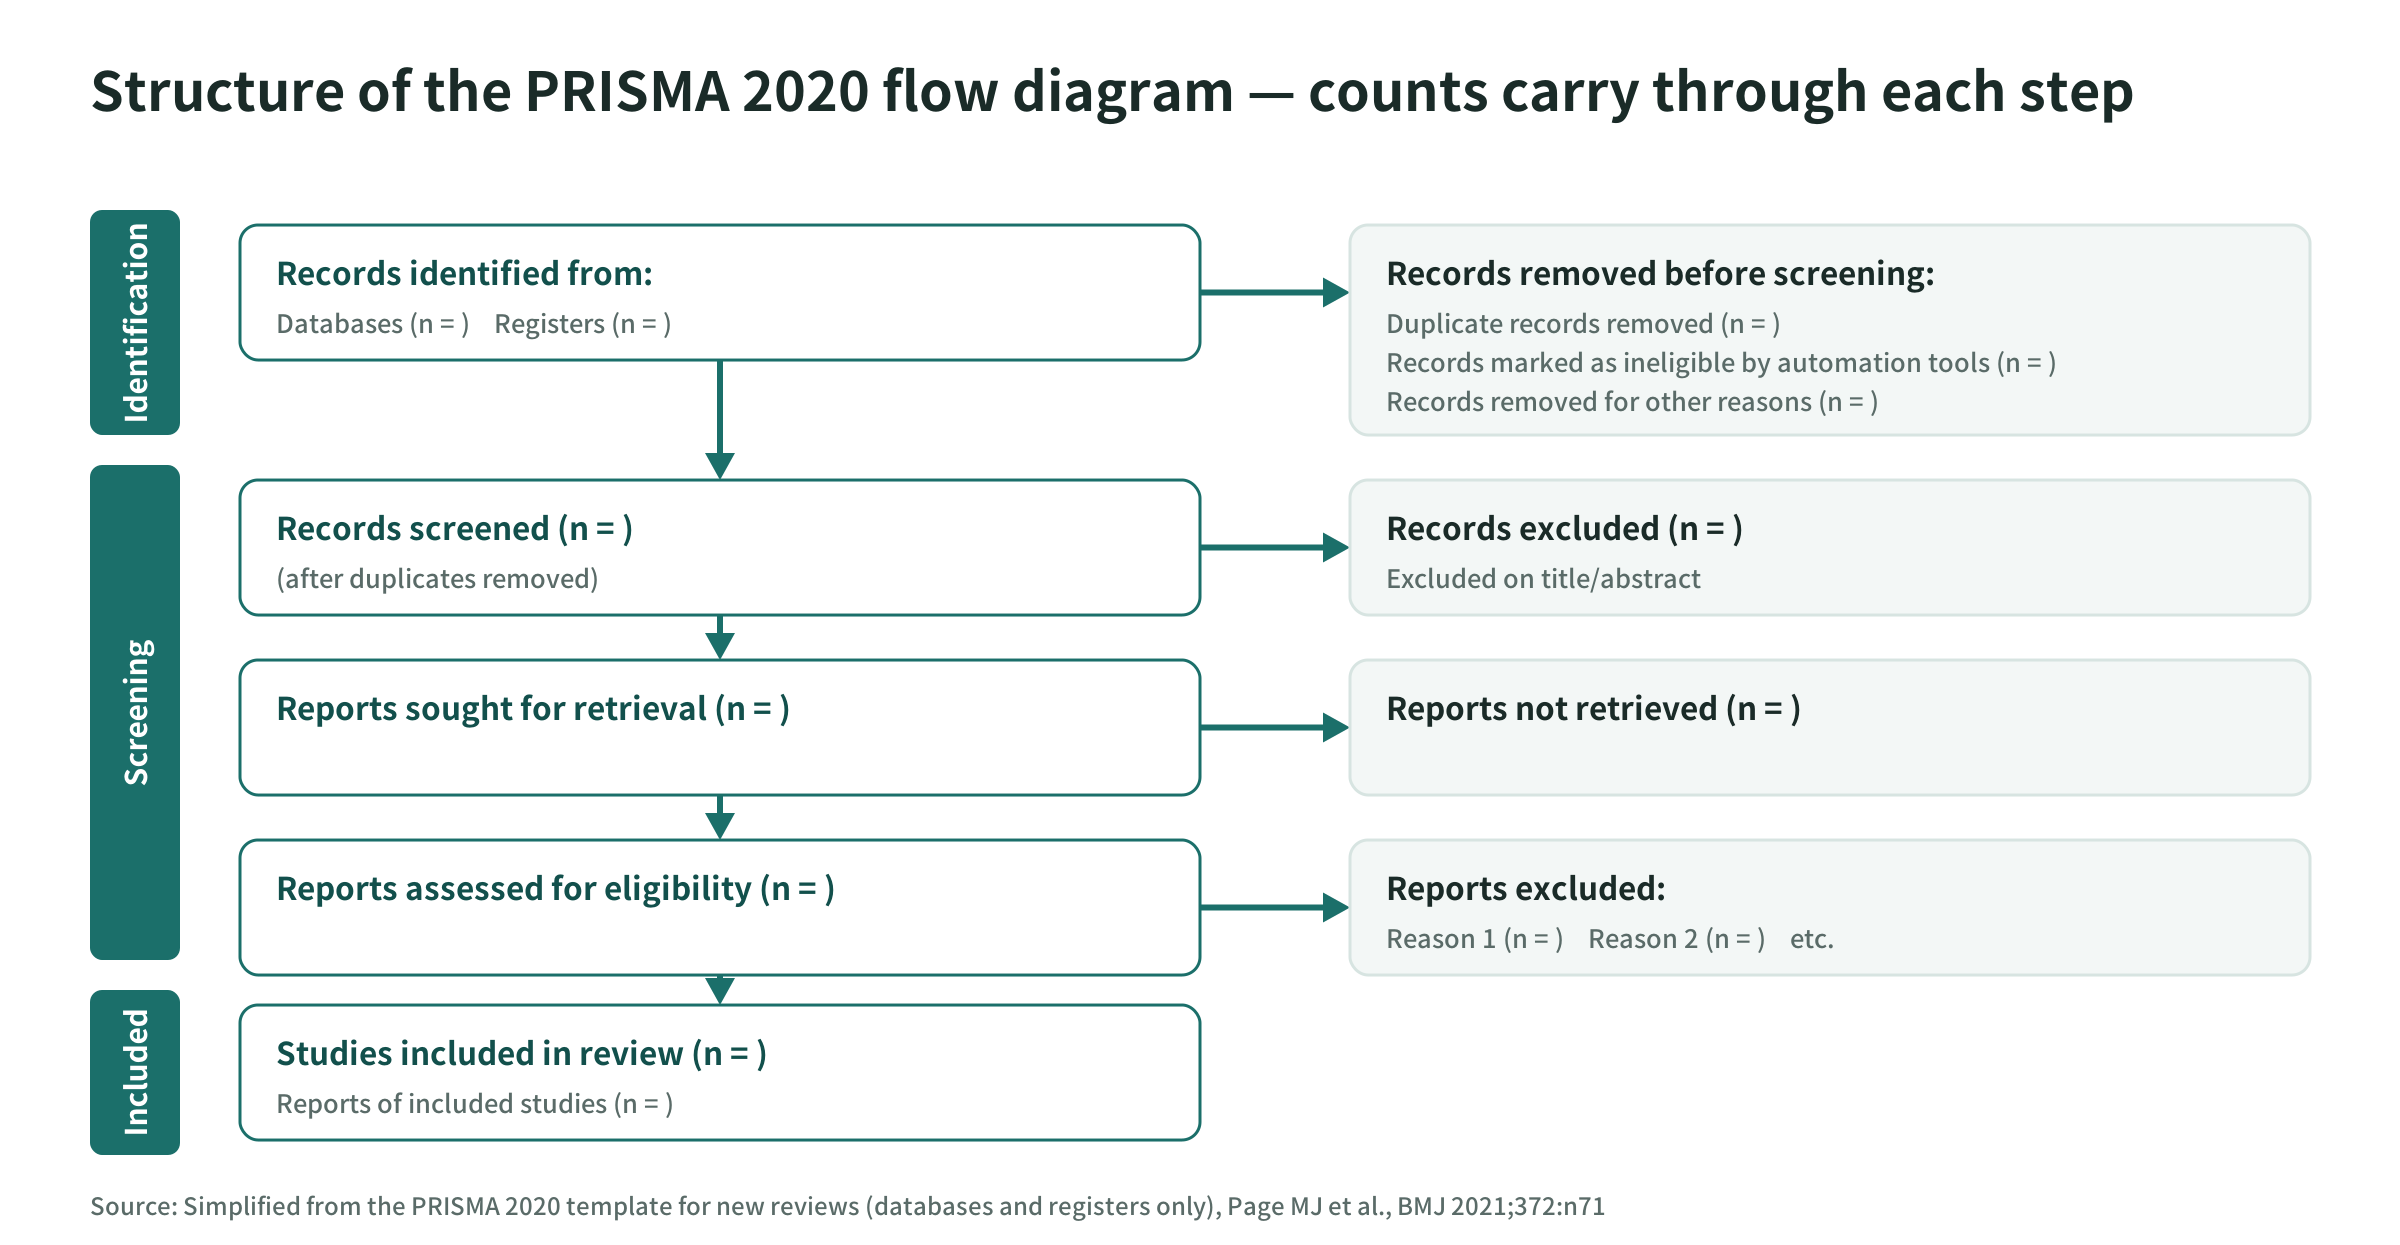
PRISMA 2020 is the reporting guideline for writing up the steps so far in a way readers can follow. It consists of a 27-item checklist and a flow diagram showing how the counts flow (a Japanese translation is Kamioka et al. 2021).
The key to the flow diagram is that the counts connect from stage to stage: how many records were found in the databases, how many remained after removing duplicates, how many were excluded at title/abstract screening, how many full texts were sought and how many obtained, how many were assessed for eligibility, how many were excluded and why, and how many were finally included. If this arithmetic doesn’t add up, there is an unexplained operation somewhere.
The Minds approach formalizes this process as a set of templates, from SR-1 “Database search results” to SR-15 “Future Research Question” (SR-2 is the literature search flowchart, SR-5/SR-6 are the assessment sheets for individual studies, SR-7 is the body of evidence, and SR-12 onward are the SoF tables).
6. How Much Time and Labor It Takes
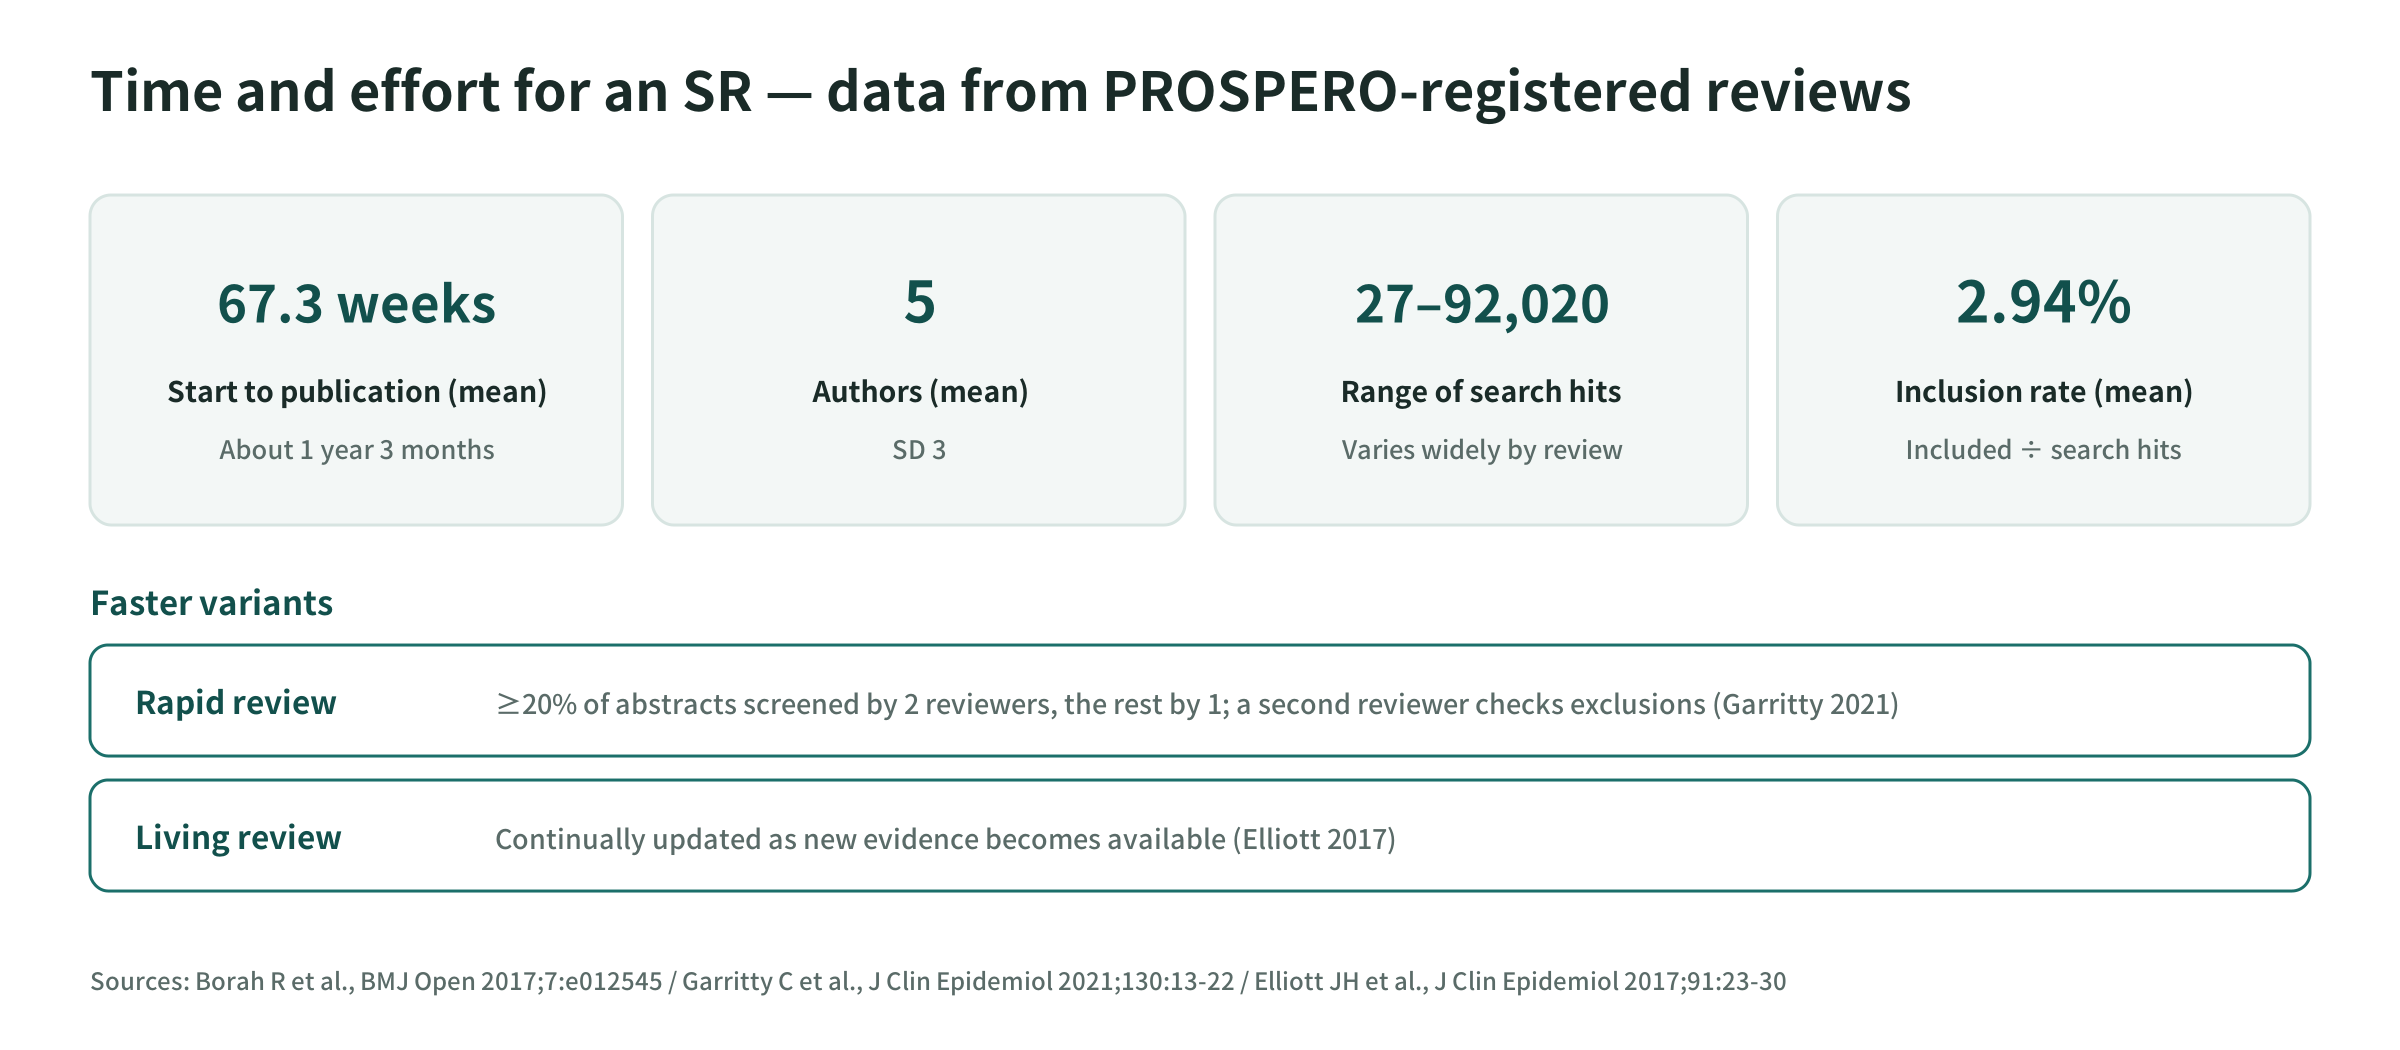
Among SRs registered in PROSPERO, the time from start to publication averaged 67.3 weeks (about 1 year and 3 months), with an average of 5 authors (Borah 2017). The number of search hits ranged from 27 to 92,020, differing by more than three orders of magnitude across reviews.
The problem is that by the time an SR is completed after more than a year, new studies have appeared since the search date. Because an SR has the structural weakness of being “slightly out of date the moment it is published,” two variants are used.
- Rapid review: deliberately simplify the procedure to deliver faster. Cochrane’s guidance breaks it down into, for example, having two people screen at least 20% of the abstracts to calibrate the criteria, having one person screen the rest, and having a second person check the excluded records (Garritty 2021)
- Living review: rather than finishing once, update continuously whenever new evidence appears (Elliott 2017)
Both have the same core problem: how to reduce the screening workload.
7. Uses in Pharma and Healthcare
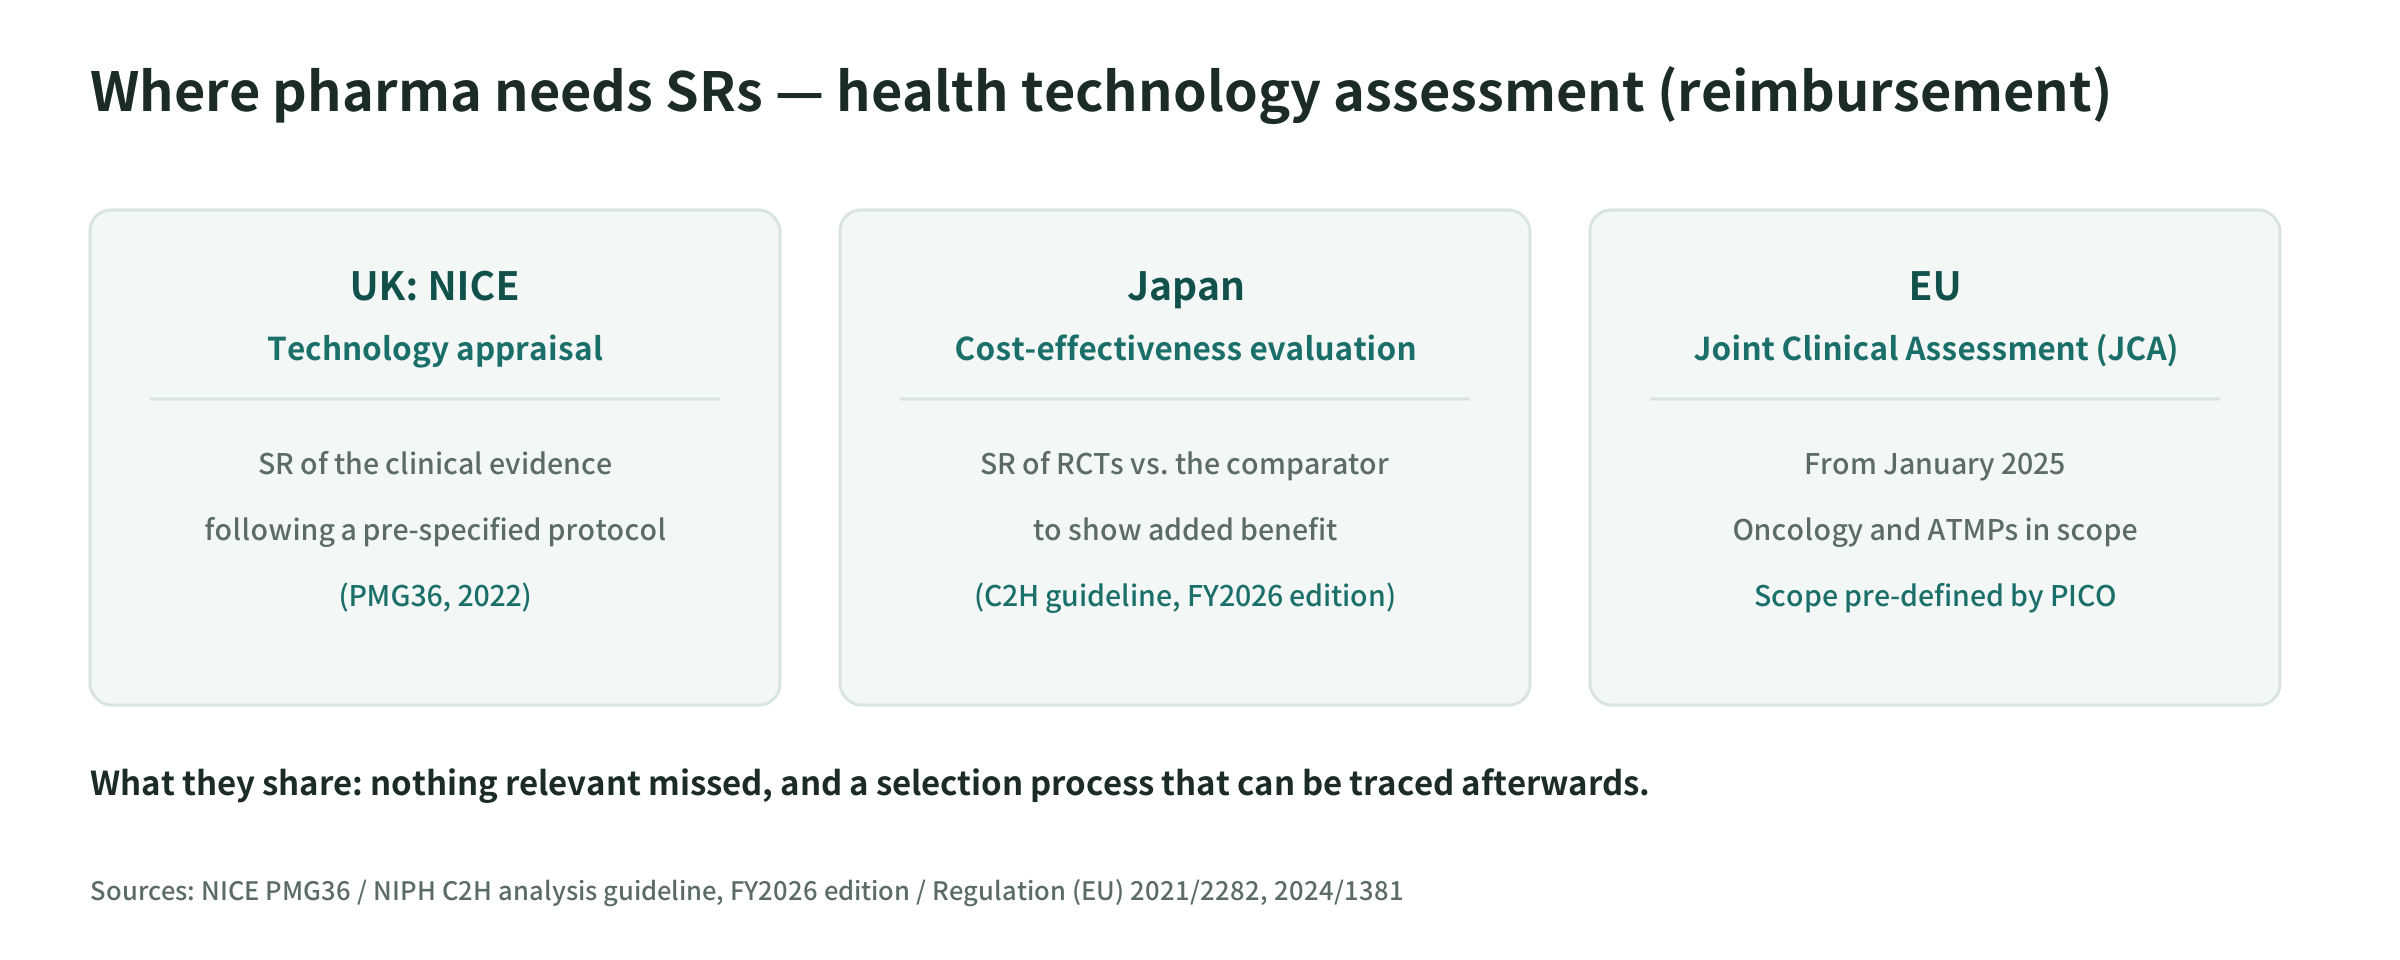
For pharmaceutical companies, an SR is, before it is an academic activity, submission material for health technology assessment (reimbursement).
- UK NICE: technology appraisals require an SR of the clinical evidence based on a predefined protocol (PMG36, 2022)
- Japan’s cost-effectiveness evaluation: the FY2026 analysis guideline assumes that additional benefit over the comparator technology is demonstrated by an SR of RCTs
- EU Joint Clinical Assessment (JCA): started in January 2025, covering oncology and ATMPs. The scope of the assessment is fixed in advance in the form of PICO
What is required in common is two things: that nothing is missed, and that the selection process can be traced afterward. Neither can be substituted by “I read a lot”; both have to be shown through procedure and records.
8. Common Pitfalls
- Narrowing the search too much: narrowing the search query to improve precision leads to misses. SR searches tolerate noise
- Putting outcomes in the search query: some outcomes are not mentioned in the abstract, so studies get dropped
- Changing the criteria afterward: revising the eligibility criteria after reading the literature is the same as selecting after seeing the results. If you do change them, report when and why
- Confusing the number of papers with the number of trials: if one trial is split across several papers, the same patients get double-counted
- Rating risk of bias per study: rate it per outcome
- Forcing heterogeneous studies together: you will get a number, but it will be a meaningless average. Deciding not to pool is also a correct answer
- Ignoring existing SRs: Minds explicitly allows using existing SRs (using their pooled results as is, adding new studies with the same search strategy, etc.). There is no need to start from scratch
9. Summary
- An SR is a study that collects studies without gaps using a predefined procedure, appraises their quality, and synthesizes them. It is a procedure for flattening out the fluctuation from chance and bias that any single study carries
- It sits at the top of the evidence hierarchy, but the grounds for that position are the procedure, not the format, and certainty is rated individually with GRADE
- The six steps are PICO and protocol → search → title/abstract and full-text screening → data extraction → risk of bias → synthesis and GRADE
- Inclusion judgments and data extraction must be done independently by two people (MECIR C39 / C46)
- On average 2.94% of search hits end up included. More than 97% of the reading is reading in order to exclude
- Reporting follows PRISMA 2020. The minimum requirement is that the counts connect from stage to stage and that exclusion reasons can be traced
- An average of 67.3 weeks per SR. That is why rapid reviews and living reviews exist, and for both the screening workload is the core problem
10. Next Steps
That last point, how to reduce the screening workload, is taken up from the side of machine support. The lineage of techniques, from supervised classification through active learning and zero-shot LLM judgment to agent-based approaches, and evaluation metrics such as recall, WSS@95%, and Recall@k, are laid out in the next explainer page, “[Technical Explainer] Literature Screening Automation.”
Building on that, the main posts of the series take the method of a paper that used an LLM for search, screening, and data extraction (TrialMind), rebuild it with Claude Code, and compare the results with the original paper.
Sources
- Higgins JPT et al. (eds). Cochrane Handbook for Systematic Reviews of Interventions, version 6.5. Cochrane, 2024
- Japan Council for Quality Health Care, EBM Medical Information Division (Minds). Minds Manual for Guideline Development 2020 ver. 3.0
- Japan Council for Quality Health Care, EBM Medical Information Division (Minds). Systematic Reviews for Clinical Practice Guideline Development (Basic course training material, published March 29, 2024)
- Page MJ et al. The PRISMA 2020 statement. BMJ 2021;372:n71
- Kamioka H et al. Explanation and Japanese translation of "The PRISMA 2020 statement: an updated guideline for reporting systematic reviews". Jpn Pharmacol Ther 2021;49:831-842
- Rethlefsen ML et al. PRISMA-S. Syst Rev 2021;10:39
- McGowan J et al. PRESS Peer Review of Electronic Search Strategies: 2015 Guideline Statement. J Clin Epidemiol 2016;75:40-46
- Richardson WS et al. The well-built clinical question. ACP J Club 1995;123(3):A12-A13
- Borah R et al. Analysis of the time and workers needed to conduct systematic reviews. BMJ Open 2017;7:e012545
- Bastian H, Glasziou P, Chalmers I. Seventy-five trials and eleven systematic reviews a day. PLoS Med 2010;7(9):e1000326
- Hoffmann F et al. Nearly 80 systematic reviews were published each day. J Clin Epidemiol 2021;138:1-11
- Gartlehner G et al. Single-reviewer abstract screening missed 13 percent of relevant studies. J Clin Epidemiol 2020;121:20-28
- Waffenschmidt S et al. Single screening versus conventional double screening. BMC Med Res Methodol 2019;19:132
- Cochrane. MECIR Manual, C39 / C46
- Sterne JAC et al. RoB 2. BMJ 2019;366:l4898 / ROBINS-I. BMJ 2016;355:i4919
- Higgins JPT, Thompson SG. Quantifying heterogeneity in a meta-analysis. Stat Med 2002;21:1539-1558
- Guyatt GH et al. GRADE. BMJ 2008;336:924-926
- Balshem H et al. GRADE guidelines: 3. Rating the quality of evidence. J Clin Epidemiol 2011;64(4):401-406
- Murad MH et al. New evidence pyramid. Evid Based Med 2016;21(4):125-127
- Garritty C et al. Cochrane Rapid Reviews Methods Group guidance. J Clin Epidemiol 2021;130:13-22
- Elliott JH et al. Living systematic review: 1. J Clin Epidemiol 2017;91:23-30
- De Bruin J et al. SYNERGY dataset. DataverseNL 2023, doi:10.34894/HE6NAQ
- NICE. PMG36 technology appraisal and highly specialised technologies guidance: the manual (2022)
- Center for Outcomes Research and Economic Evaluation for Health (C2H), National Institute of Public Health. Guideline for Preparing Cost-Effectiveness Evaluation to the Central Social Insurance Medical Council, FY2026 edition (approved by the Chuikyo general meeting on January 16, 2026)
- Regulation (EU) 2021/2282 on health technology assessment / Implementing Regulation (EU) 2024/1381
- NLM. PubMed About / MEDLINE PubMed Production Statistics